Source page: McKinsey & Company
Commentary
How e-commerce share of retail soared across the globe: A look at eight countries
COVID-19 | Retail
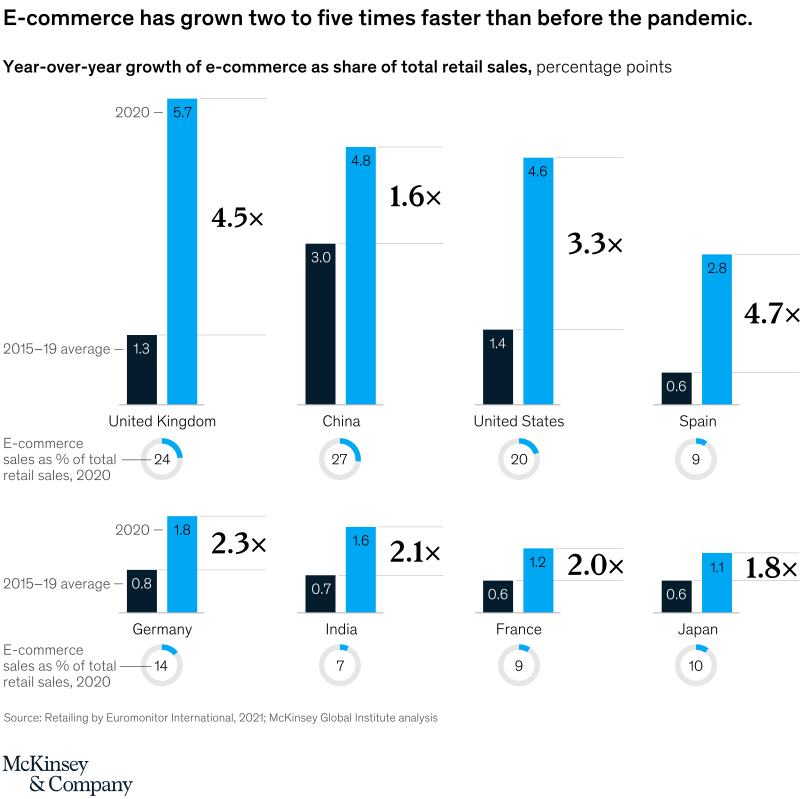
March 5, 2021 – Online retail has been growing consistently. But in 2020, consumers went all in; in the United Kingdom, for example, e-commerce growth leapt nearly fivefold. Other countries also saw large gains.
To read the report, see The future of work after COVID-19, February 18, 2021.
customizer here
Visual form
Eight-panel small-multiple bar chart with donut callouts.
Layout / body structure
The chart is arranged as two rows of four country panels. In each panel, a dark bar for the 2015 to 2019 average sits beside a blue bar for 2020, a multiplier callout sits between or beside the bars, and a small donut below shows e-commerce share of total retail sales in 2020.
What is being compared
It compares the year-over-year growth of e-commerce as a share of total retail sales across eight countries: the United Kingdom, China, the United States, Spain, Germany, India, France, and Japan. It also compares each country’s 2020 e-commerce share of total retail sales through the donut indicators.
Measurement system
The main bar measure is percentage-point growth, contrasting the 2015 to 2019 average with 2020. Each panel also prints a times-multiple acceleration and a separate donut number showing e-commerce sales as a percent of total retail sales in 2020.
Visible structure inside the graphic
Every country panel repeats the same two-bar pattern, which makes the 2020 surge easy to compare across markets. The oversized multiplier labels summarize the jump at a glance, while the bottom-row donuts add a second layer by showing how large e-commerce already was in each country’s retail mix.
Main takeaway from the visual
E-commerce growth accelerated sharply everywhere, but the size of the jump depended on each market’s starting point. The United Kingdom, Spain, and the United States show especially large step-ups versus their pre-pandemic baselines, while China starts from the highest baseline and therefore shows the smallest multiplier even though its 2020 bar remains very high in absolute terms.
Key standout values or extremes
The United Kingdom rises from a 1.3-point 2015 to 2019 average to 5.7 points in 2020, a 4.5 times acceleration, while Spain moves from 0.6 to 2.8 points, a 4.7 times jump, and the United States rises from 1.4 to 4.6 points, a 3.3 times jump. China goes from 3.0 to 4.8 points for a 1.6 times increase; Germany goes from 0.8 to 1.8, India from 0.7 to 1.6, France from 0.6 to 1.2, and Japan from 0.6 to 1.1. The donut callouts show 2020 e-commerce retail shares of 27 percent in China, 24 in the United Kingdom, 20 in the United States, 14 in Germany, 10 in Japan, 9 in Spain, 9 in France, and 7 in India.
Controls / sequence, when applicable
This is a static chart image with no in-chart controls to operate.
Companion media, when applicable
There is no separate companion audio or video; the chart image is the full visual on this page.