Source page: McKinsey & Company
Commentary
How India Inc. could write a new chapter
India | M&A
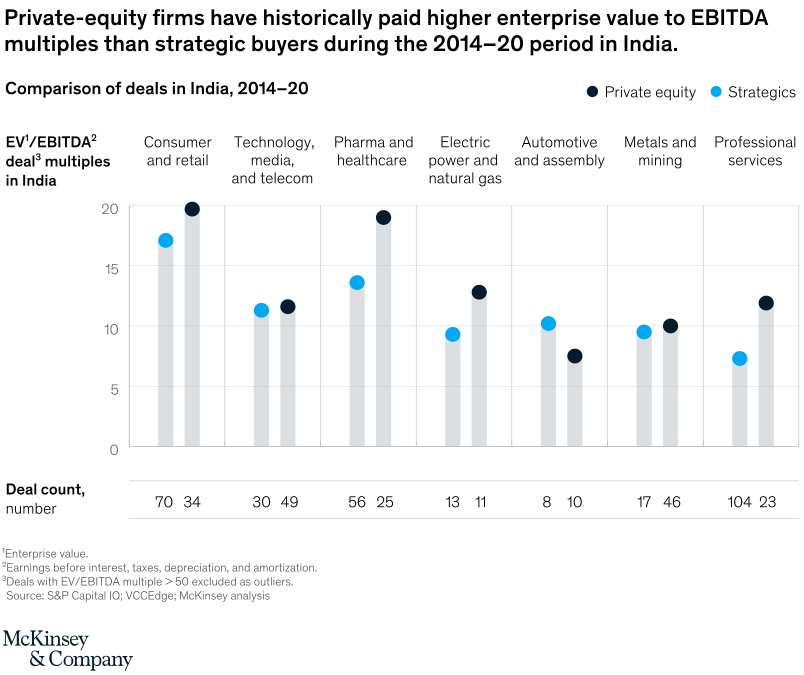
August 11, 2021 – Indian companies could unlock substantial value by selling businesses, and now may be a particularly propitious time to divest. Our research finds that companies should consider private equity buyers, which have historically been willing to pay more. PE firms’ ability to attract top talent, undertake transformations, and employ better capital discipline may explain their willingness to bid more than strategic buyers.
To read the article, see “Unlocking value through divestitures: Can Indian firms seize the moment?,” July 20, 2021.
customizer here
Visual form
Paired-dot comparison chart with a deal-count row.
Layout / body structure
The chart is a single left-to-right sector comparison with one paired set of dots for each industry and a deal-count strip underneath. Read each sector column from the two multiple markers down to the counts below, then move across the seven industries.
What is being compared
The chart compares enterprise-value-to-EBITDA deal multiples paid by private-equity firms versus strategic buyers across seven industry groups in India from 2014 to 2020. It also compares how many deals each buyer type completed in those sectors.
Measurement system
The vertical axis measures EV to EBITDA multiples, while the bottom row lists deal counts as raw numbers. Dark dots represent private equity and blue dots represent strategics, with a light gray stem behind each pair to anchor the two values in the same sector.
Visible structure inside the graphic
Each industry column contains two dots at different heights on a shared multiples scale. Beneath the plot, a second strip prints the deal counts for the two buyer groups in the same order, so the reader can compare price levels and deal activity together across consumer and retail, technology media and telecom, pharma and healthcare, electric power and natural gas, automotive and assembly, metals and mining, and professional services.
Main takeaway from the visual
Private-equity buyers generally sit above strategic buyers on valuation multiples in most sectors, so the higher-price pattern is visible across the chart rather than limited to one or two industries. The main exception is automotive and assembly, where strategics sit above private equity.
Key standout values or extremes
Consumer and retail is the highest pair overall, with private equity around 20 times and strategics around the high teens. Pharma and healthcare is another wide gap, with private equity near 19 and strategics around 14. Automotive and assembly flips the usual pattern, with strategics around 10.5 versus private equity around 8. Professional services also shows a large spread, at roughly 12-plus for private equity versus around 8 for strategics.
Controls / sequence, when applicable
This is a static chart image with no in-chart controls to operate.
Companion media, when applicable
There is no separate companion audio or video; the chart image is the full visual on this page.