Source page: McKinsey & Company
Commentary
How jobs are changing as automation and digitization take hold
Operations | Jobs | Digital
September 1, 2020 – When undergoing a digital transformation, an organization should think about how it can redeploy its people’s existing skills into new roles, then figure out where it makes sense to hire externally.
To read the article, see “Building the vital skills for the future of work in operations,” August 7, 2020.
customizer here
Visual form
Sankey-style role-flow diagram.
Layout / body structure
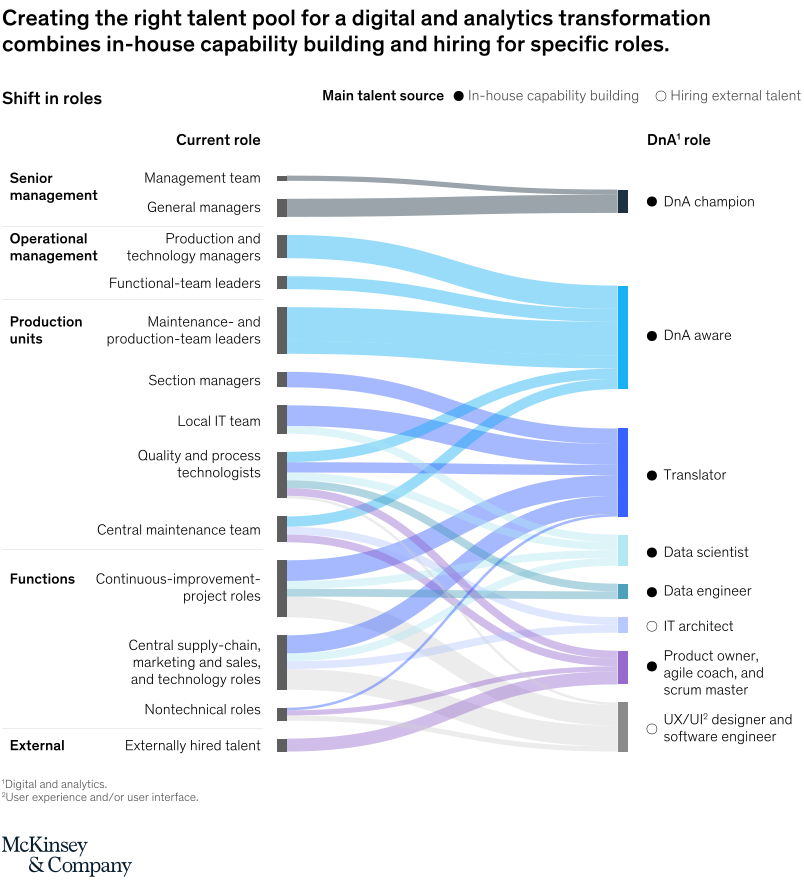
The chart is a left-to-right flow chart with current roles on the left and DnA roles on the right. Read each stream from its current-role label across the center to the destination role, while also using the top legend to distinguish in-house capability building from hiring external talent.
What is being compared
The chart compares how existing roles inside an operation can shift into digital-and-analytics roles during a transformation. It also compares which talent pathways rely on in-house capability building versus external hiring.
Measurement system
This chart is categorical rather than numeric. Position and connecting flow lines show role transitions, while the legend encodes the main talent source for each destination path.
Visible structure inside the graphic
The left side is grouped by organizational layers such as senior management, operational management, and production units, with current-role labels including management team, general managers, production and technology managers, functional-team leaders, maintenance- and production-team leaders, section managers, local IT team, and quality and process technologists. Those roles feed through colored streams toward DnA roles on the right, including DnA champion, DnA aware, translator, and data scientist, with additional downstream roles continuing lower on the page.
Main takeaway from the visual
The chart shows that a digital-and-analytics workforce is built by redirecting many existing roles into new destinations rather than replacing the organization wholesale. Most of the visible flow is driven by internal reskilling, while a smaller share is explicitly marked for externally hired talent.
Key standout values or extremes
There are no numeric values in this chart. The strongest visible structural signal is the thick concentration of streams flowing into broad DnA-aware and translator destinations, while the DnA champion path is narrower and tied to the upper management roles.
Controls / sequence, when applicable
This is a static chart image with no in-chart controls to operate.
Companion media, when applicable
There is no separate companion audio or video; the chart image is the full visual on this page.