Source page: McKinsey & Company
Commentary
How medtech leaders create value
Healthcare | Pharmaceuticals & Medical Products
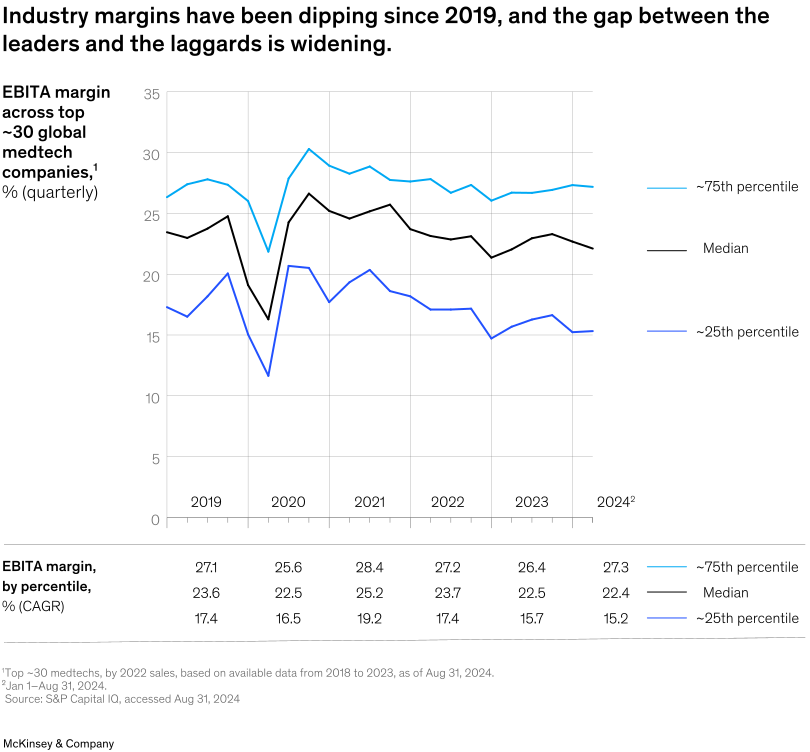
December 18, 2024 – The global medtech sector has faced disruptions for several years, such as a steep drop in medical procedures during the height of the pandemic and, more recently, surging inflation. Since 2019, industry margins have declined by about 100 basis points, and the gap between the top and bottom performers has grown. Now, as the financial landscape stabilizes, the strategies distinguishing industry leaders from laggards are becoming clear, note senior partner Delphine Nain Zurkiya and colleagues.
To read the article, see “Value creation priorities shaping medtech,” October 16, 2024.
customizer here
Visual form
Three-line time-series chart with a percentile summary table underneath.
Layout / body structure
The chart is a single line chart across quarterly time from 2019 into 2024, followed by a compact percentile table beneath it. Read the lines left to right first to see how the 75th percentile, median, and 25th percentile margins evolve, then use the table below to compare annualized percentile levels year by year.
What is being compared
It compares EBITA margins across the top roughly 30 global medtech companies at the 75th percentile, median, and 25th percentile. The chart shows how industry performance changed over time and how the spread between leaders and laggards widened.
Measurement system
The main chart is measured in EBITA margin percentage by quarter, while the table below summarizes the percentile values by year. Color distinguishes the percentile lines, and the shared time axis lets the reader compare movement and spread over the same period.
Visible structure inside the graphic
The top section contains three continuous lines, with the light-blue 75th percentile line highest, the black median line in the middle, and the darker blue 25th percentile line lowest. The table beneath repeats the percentile ordering numerically, reinforcing the separation visible in the line chart.
Main takeaway from the visual
The visual shows that industry margins have trended down since 2019 and that the gap between the strongest and weakest performers has widened. The top line stays materially above the median and lower quartile, while the lower line falls more sharply and remains well below the leaders by the end of the period.
Key standout values or extremes
In 2019 the percentile table shows about 27.1 for the 75th percentile, 23.6 for the median, and 17.4 for the 25th percentile; by 2024 those values are about 27.3, 22.4, and 15.2. The 25th percentile drops the most over the period, and the spread between the 75th and 25th percentiles grows from under 10 points in 2019 to more than 12 points by 2024.
Controls / sequence, when applicable
This is a static chart image with no in-chart controls to operate.
Companion media, when applicable
There is no separate companion audio or video; the chart image is the full visual on this page.