Source page: McKinsey & Company
Commentary
How physical distancing has played out for European businesses
COVID-19 | Remote work | Europe
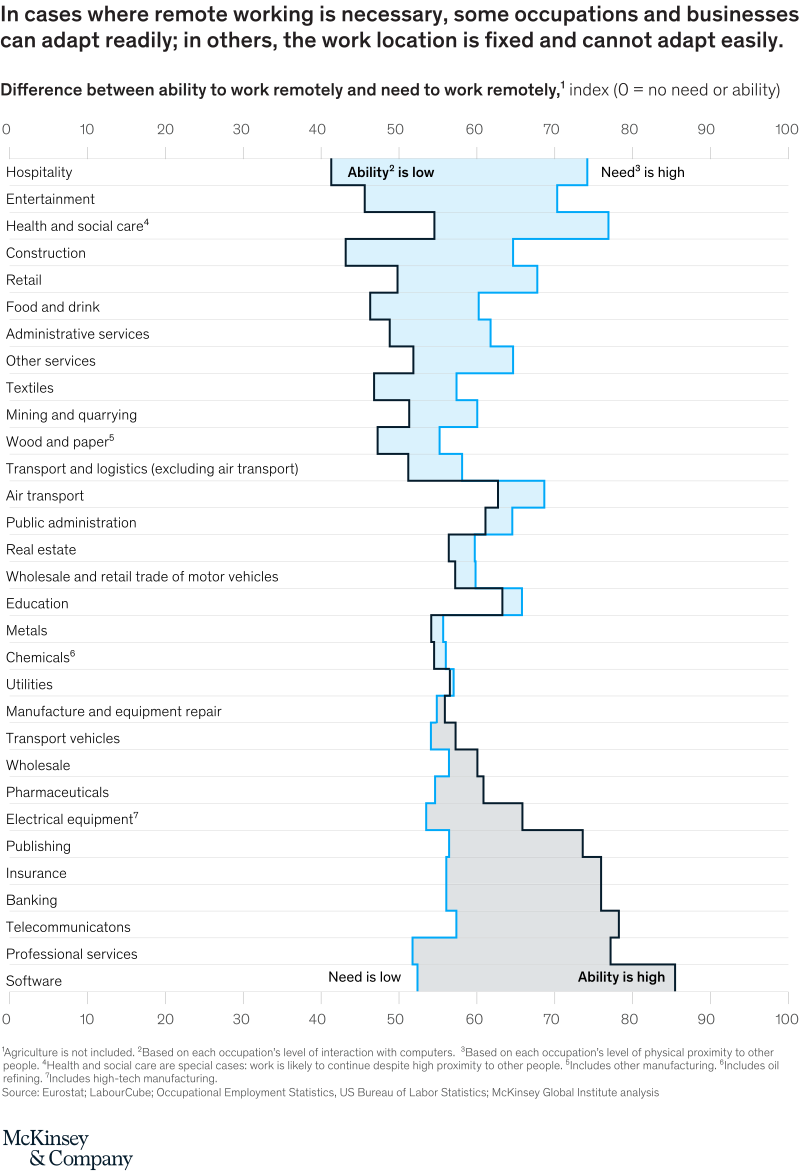
May 6, 2020 – As coronavirus-related lockdowns went into effect, companies across Europe had to quickly assess how to keep their employees and customers safe through physical distancing. How they chose to adapt was based on whether they needed people to work remotely because the risk of infection spread was high in their industry, as well as how easy it was to have people work remotely. Those with high need and low ability have been the ones most disrupted by employee-related challenges—namely (and not surprisingly), hospitality, construction, entertainment, retail, and personal services.
To read the article, see “How European businesses can position themselves for recovery,” April 2020.
customizer here
Visual form
Table (with Visual Encoding): horizontal industry profile table for remote-work need and adaptability.
Layout / body structure
The graphic lists European industries and occupations in rows and places each row against a horizontal 0-to-100 percent scale. Two stepped outlines trace the relationship between the need to work remotely and the ability to adapt, with a gray band making the mismatch between the two visible.
What is being compared
It compares sectors by how much physical distancing pushes work toward remote operation and how easily that work can actually be done remotely. The comparison separates sectors where distance is necessary but hard to achieve from sectors that can move work online more readily.
Measurement system
The horizontal scale is a percentage scale. Each row’s position shows the relative level of remote-work need or remote-work adaptability, and the visual encoding is the distance between those profiles rather than a single ranked value.
Visible structure inside the graphic
Hospitality, entertainment, retail, food and drink, construction, transport, and personal services sit on the constrained side of the table, where work location is fixed or difficult to adapt. Professional services, finance, software, telecommunications, and banking sit closer to the adaptable side.
Main takeaway from the visual
Physical distancing did not create the same operating problem for every business. The most disrupted sectors are those with high distancing need and low remote-work adaptability, while knowledge and professional services have more room to keep operating remotely.
Key standout values or extremes
The constrained end includes hospitality, construction, entertainment, retail, and personal services. The adaptable end includes software, professional services, banking, telecommunications, and finance, making the sector split sharper than a single Europe-wide average would show.
Controls / sequence, when applicable
This is a static table with visual encoding; there are no in-chart controls to operate.
Companion media, when applicable
There is no separate companion audio or video; the table chart is the full visual on this page.