Source page: McKinsey & Company
Commentary
How renewables can materialize
Sustainability | Decarbonization | Renewable energy
March 14, 2023 – Countries are eyeing renewable-energy options to meet decarbonization goals. But price fluctuations for raw materials and shifting regulations have resulted in unstable renewables markets, making planning a challenge. Senior partner Alberto Bettoli and colleagues suggest targeted acquisitions and long-term partnerships as ways to secure raw materials and reduce price volatility.
To read the article, see “Renewable-energy development in a net-zero world: Disrupted supply chains,” February 17, 2023.
customizer here
Visual form
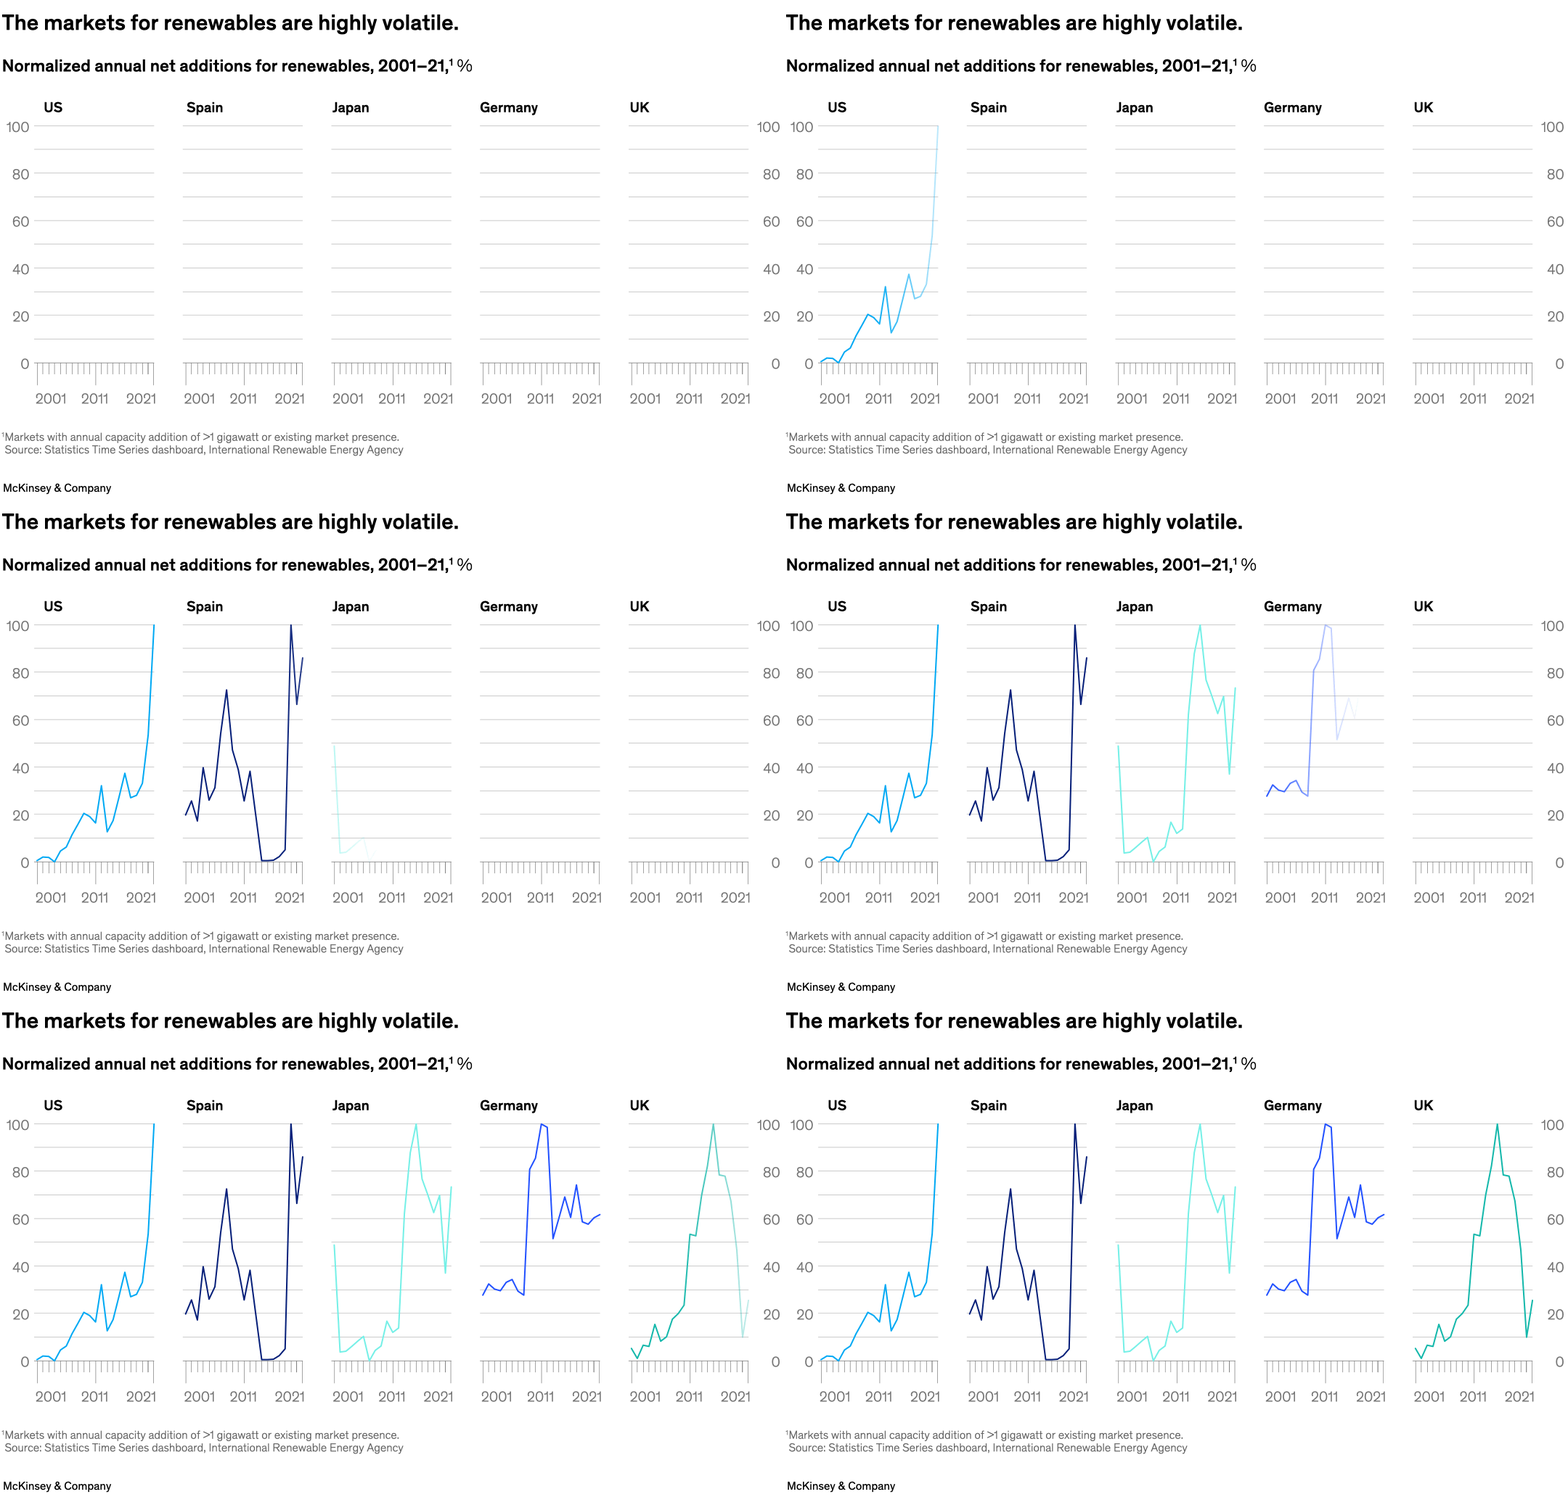
Five-panel small-multiple line chart.
Layout / body structure
The page is arranged as five narrow line charts in one row, one each for the United States, Spain, Japan, Germany, and the United Kingdom. Reader moves left to right across countries while reading each series over the same 2001 to 2021 timeline.
What is being compared
It compares normalized annual net additions for renewables across five countries over two decades.
Measurement system
The values are percentages on a shared vertical scale, so the lines can be compared directly across panels without re-scaling the y-axis.
Visible structure inside the graphic
Each country has a single line with sharp spikes and drops rather than a smooth trend. The shared layout makes differences in volatility visible at a glance, because some panels leap from near zero to near 100 and then retreat quickly, while others oscillate more often around mid-range values.
Main takeaway from the visual
No panel shows a stable upward path. Instead, each country’s renewables market swings sharply, which makes volatility itself the dominant visual pattern rather than any one country’s steady leadership.
Key standout values or extremes
Several countries hit or approach the 100 mark at different points, including the United States near the end of the series, Spain in the late 2000s, Japan in the mid-2010s, Germany in the early 2010s, and the United Kingdom in the late 2010s. Each of those peaks is followed by a marked drop, underlining how unstable the market is across geographies.
Controls / sequence, when applicable
This is a static chart image with no in-chart controls to operate.
Companion media, when applicable
There is no separate companion audio or video; the chart image is the full visual on this page.