Source page: McKinsey & Company
Commentary
How we hoarded
Consumer | COVID-19
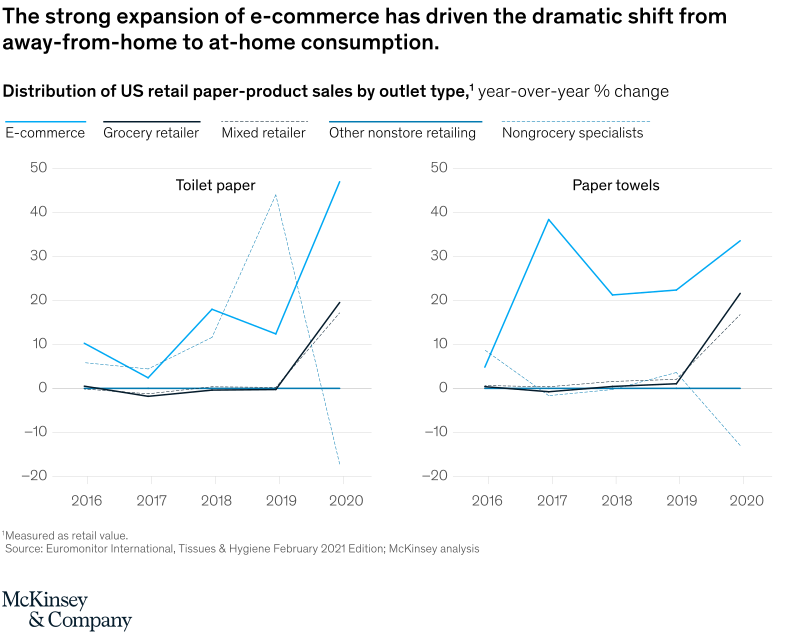
December 14, 2021 – In the pandemic, consumers bought everything online. E-commerce sales of toilet paper nearly tripled, and paper towels rose by about 50 percent.
To read the article, see “Beyond COVID-19: The new consumer behavior is sticking in the tissue industry,” October 26, 2021.
customizer here
Visual form
Two-panel multi-series line chart.
Layout / body structure
The chart is split into two side-by-side time-series panels, with toilet paper on the left and paper towels on the right. Reader follows the same five outlet-type lines across both panels from 2016 through 2020 and compares how each retail channel behaves in the two product categories.
What is being compared
The chart compares year-over-year changes in US retail paper-product sales by outlet type. It contrasts e-commerce, grocery retailers, mixed retailers, other nonstore retailing, and nongrocery specialists across toilet paper and paper towels.
Measurement system
The vertical axis is year-over-year percent change, ranging from about negative 20 percent up to positive 50 percent. The horizontal axis is time from 2016 to 2020, and line color or stroke distinguishes the five outlet types in each panel.
Visible structure inside the graphic
Each panel carries five lines on the same axes, with the bright blue e-commerce line separating sharply from the pack by the end of the period. The other outlet lines stay much closer to zero for most of the series, then some rise modestly in 2020 while the light dashed mixed-retailer line swings sharply from a positive spike into negative territory.
Main takeaway from the visual
E-commerce is the clearest growth engine in both paper categories, while the rest of the channel mix moves much less dramatically. The strongest visual signal is the steep 2020 rise of the e-commerce line in both panels, which makes the at-home purchasing shift look concentrated in online demand rather than evenly spread across all outlet types.
Key standout values or extremes
For toilet paper, the e-commerce line ends near the upper 40s in 2020, while the mixed-retailer line falls to roughly negative 18 after peaking near the mid-40s a year earlier. For paper towels, e-commerce ends in the low 30s in 2020, and nongrocery specialists rise to a little above 20, while the light dashed line drops into negative territory by year-end.
Controls / sequence, when applicable
This is a static chart image with no in-chart controls to operate.
Companion media, when applicable
There is no separate companion audio or video; the chart image is the full visual on this page.