Source page: McKinsey & Company
Commentary
If you build it, they will ride
Mobility | Travel & Transportation
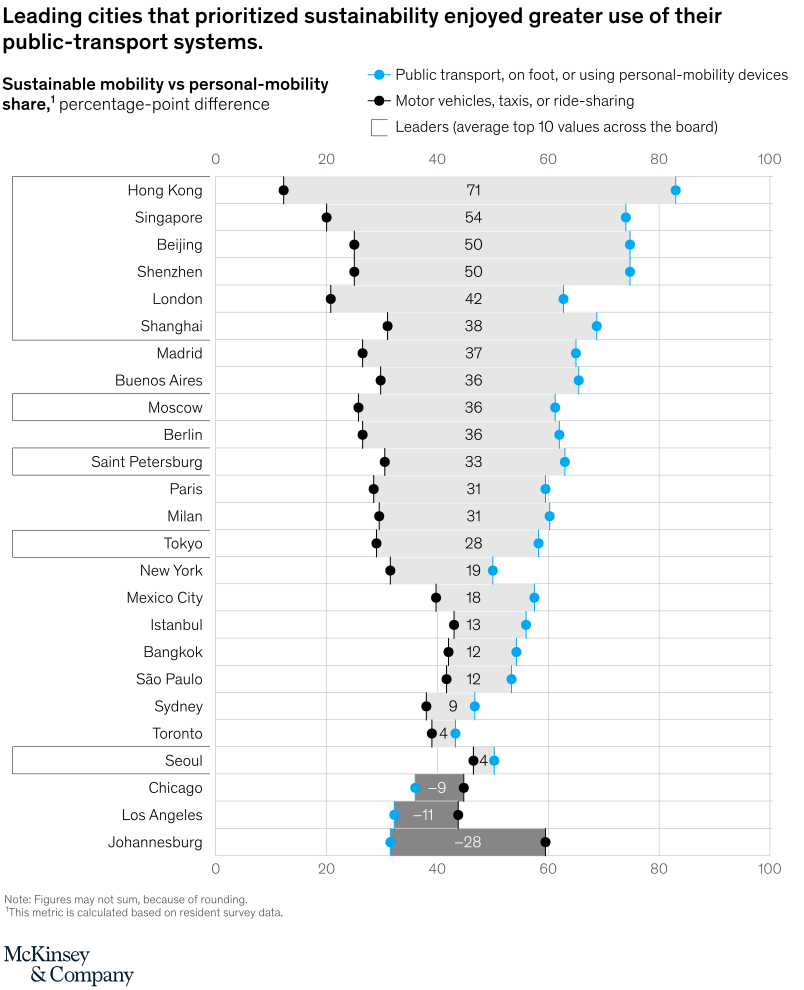
September 10, 2021 – We assessed transport systems in 25 cities worldwide. Leaders tend to invest more in sustainable mobility options (including bike rentals, bike lanes, and ride shares) than other cities do. Intriguingly, those investments have also led to greater use of public-transport systems—the original sustainable transport option.
To read the article, see “Building a transport system that works: Five insights from our 25-city report,” August 11, 2021.
customizer here
Visual form
Ranked paired-dot comparison chart.
Layout / body structure
The chart is a single long city ranking arranged top to bottom on a shared horizontal scale. Read each row from the city name at left across the two dots and the centered difference label, then move down the ordered list from the strongest positive gap to the weakest.
What is being compared
Each row compares the share of sustainable mobility use with the share of personal-mobility use for one city. Across the full chart, the chart compares how far public transport, walking, and personal-mobility devices outpace or trail motor vehicles, taxis, and ride-sharing across cities.
Measurement system
The dots sit on a 0 to 100 percentage-point scale. Blue marks public transport, walking, or personal-mobility devices, black marks motor vehicles, taxis, or ride-sharing, and the centered number on each row shows the percentage-point difference between those two shares.
Visible structure inside the graphic
Each city row contains two dots on the same horizontal line plus a numeric gap label in the middle. The rows are sorted from high positive gaps at the top to negative gaps at the bottom, and a gray highlighted band flags the leader group average across the board.
Main takeaway from the visual
Cities that prioritized sustainability visibly separate into a strong top tier where blue sustainable-mobility dots sit far to the right of black personal-mobility dots. The bottom of the ranking compresses and then flips negative, showing a few cities where personal mobility still outweighs sustainable modes.
Key standout values or extremes
Hong Kong leads with a gap of 71 percentage points, followed by Singapore at 54 and both Beijing and Shenzhen at 50. At the other end, Chicago is negative 9, Los Angeles negative 11, and Johannesburg drops to negative 28, making it the weakest row in the ranking.
Controls / sequence, when applicable
This is a static chart image with no in-chart controls to operate.
Companion media, when applicable
There is no separate companion audio or video; the chart image is the full visual on this page.