Source page: McKinsey & Company
Commentary
India pharma's growth markets
India | Operations | Pharmaceuticals & Medical Products
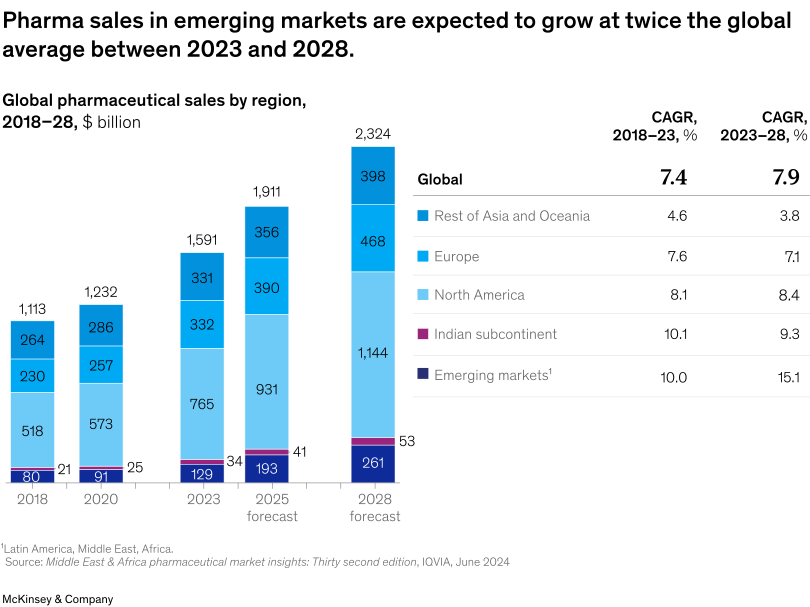
February 10, 2026 – A complex mix of forces is reshaping India’s pharmaceutical industry. For example, slower growth, pricing pressure, and intensifying competition in developed markets are pushing companies to look beyond their traditional focus on Europe, India, and the United States and toward emerging markets, note McKinsey’s Ankur Bhajanka, Jean-Baptiste Pelletier, Parag Patel, Sasikanth Dola, Sathya Prathipati, Vishnukaant Pitty, and Vivek Arora. In fact, pharma sales in emerging markets are projected to grow at nearly twice the global average from 2023 to 2028. As structural challenges in emerging markets are addressed, Indian players are expected to gain scale over the next five to seven years and unlock the potential of these regions.
To read the report, see “Shaping the future of India’s pharmaceutical operations,” November 12, 2025.
customizer here
Visual form
Stacked Bar / Stacked Column: global pharmaceutical sales by region with regional CAGR comparison.
Layout / body structure
The main chart stacks global pharma sales by region across historical years and the 2028 forecast. A companion CAGR table compares each region’s growth rate for the historical period and the 2023 to 2028 forecast period.
What is being compared
It compares pharmaceutical sales across North America, Europe, rest of Asia and Oceania, the Indian subcontinent, and emerging markets that include the Middle East, Africa, and Latin America.
Measurement system
Sales are measured in billions of US dollars. Growth is measured as compound annual growth rate for 2018 to 2023 and 2023 to 2028.
Visible structure inside the graphic
North America remains the largest block in the stack, but emerging markets expand rapidly by the 2028 forecast. The CAGR table makes the emerging-market growth rate stand out relative to the global average.
Main takeaway from the visual
The chart shows why Indian pharma companies are looking beyond their traditional developed-market focus. Emerging markets are projected to grow much faster than the global average, creating a larger opportunity outside the United States and Europe.
Key standout values or extremes
The global market rises from $1,113 billion in 2018 to a projected $2,324 billion in 2028. Emerging markets grow from $80 billion to $261 billion and accelerate to a 15.1 percent CAGR from 2023 to 2028, compared with 7.9 percent globally.
Controls / sequence, when applicable
This is a static stacked-bar market chart with a CAGR table; there are no in-chart controls to operate.
Companion media, when applicable
There is no separate companion audio or video; the global pharma sales stacked-bar chart is the full visual on this page.