Source page: McKinsey & Company
Commentary
India’s digital leap
India | Digital
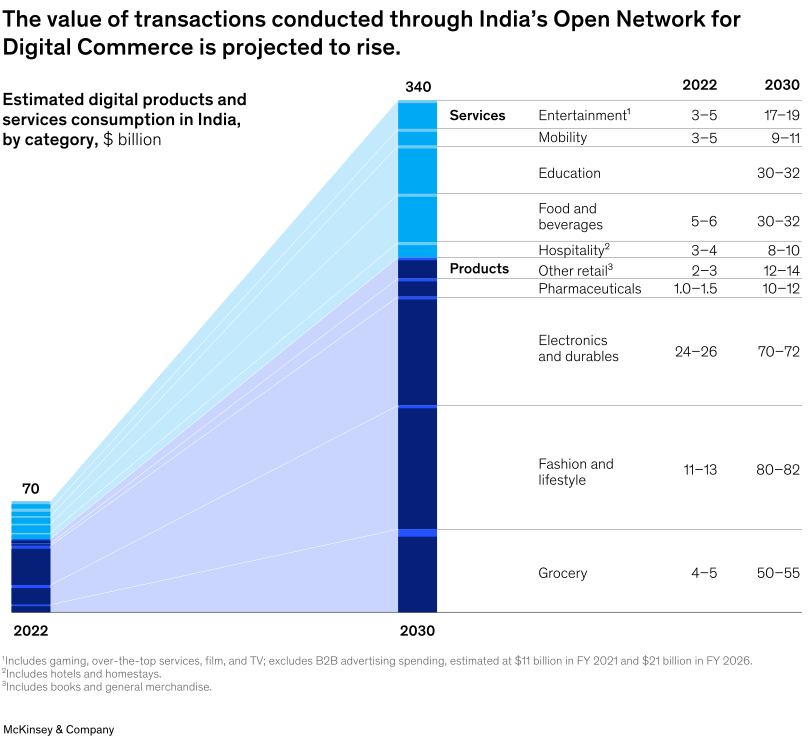
May 27, 2025 – India draws multinationals looking for new business opportunities. However, while some leaders see it only as a place for low-cost operations, the country offers much more, note Global Managing Partner Bob Sternfels, Senior Partner Shivanshu Gupta, and coauthors. For example, it boasts a thriving digital economy, with more than a billion smartphone users. Digitally connected consumers in India now make up over 40 percent of global internet transactions. In fact, the value of digital commerce through Open Network for Digital Commerce, a government-sponsored platform that connects online buyers with businesses, could rise fivefold to between $320 billion and $340 billion by 2030.
To read the article, see “India: The promise and possibilities for global companies,” April 10, 2025.
customizer here
Visual form
Two-period stacked comparison with a side breakout table. The visual combines stacked columns with connector lines and a right-hand category matrix to show how India’s digital commerce mix expands over time.
Layout / body structure
The layout reads left to right: a smaller 2022 column at the left, a much larger 2030 column in the center, and a category breakout with 2022 and 2030 values on the right. It behaves like a two-column growth comparison paired with a detailed side table for the underlying categories.
What is being compared
The chart compares estimated digital products and services consumption in India between 2022 and 2030 across service categories such as entertainment, mobility, education, food and beverages, and hospitality, and product categories such as other retail, pharmaceuticals, electronics and durables, fashion and lifestyle, and grocery.
Measurement system
Values are shown in billions of dollars, with the main stacks labeled by total size and the side matrix listing category values or ranges for 2022 and 2030. The reader is comparing both total market size and the contribution of each category inside that total.
Visible structure inside the graphic
The central structure is a stacked 2022 bar labeled 70 and a much taller stacked 2030 bar labeled 340, with pale connector bands running from the smaller stack to the larger one. On the right, the categories are split into Services and Products, and each row shows its 2022 value alongside its 2030 value so the reader can see which categories are expected to widen the most.
Main takeaway from the visual
The visible takeaway is that India’s digital commerce market is projected to become much larger and much broader by 2030, with the biggest weight sitting in product categories such as fashion and lifestyle, electronics and durables, and grocery. The side breakout also shows that service categories grow materially, but the product side dominates the overall stack.
Key standout values or extremes
The total market rises from 70 billion dollars in 2022 to 340 billion in 2030. On the right-side breakout, fashion and lifestyle grows from 11 to 13 billion to 80 to 82, electronics and durables rises from 24 to 26 to 70 to 72, grocery climbs from 4 to 5 to 50 to 55, and education and food and beverages each reach 30 to 32 by 2030.
Controls / sequence, when applicable
This is a static chart image with no in-chart controls to operate.
Companion media, when applicable
There is no separate companion audio or video; the chart image is the full visual on this page.