Source page: McKinsey & Company
Commentary
Inflation on the mind
Strategy | Corporate finance | C-Suite
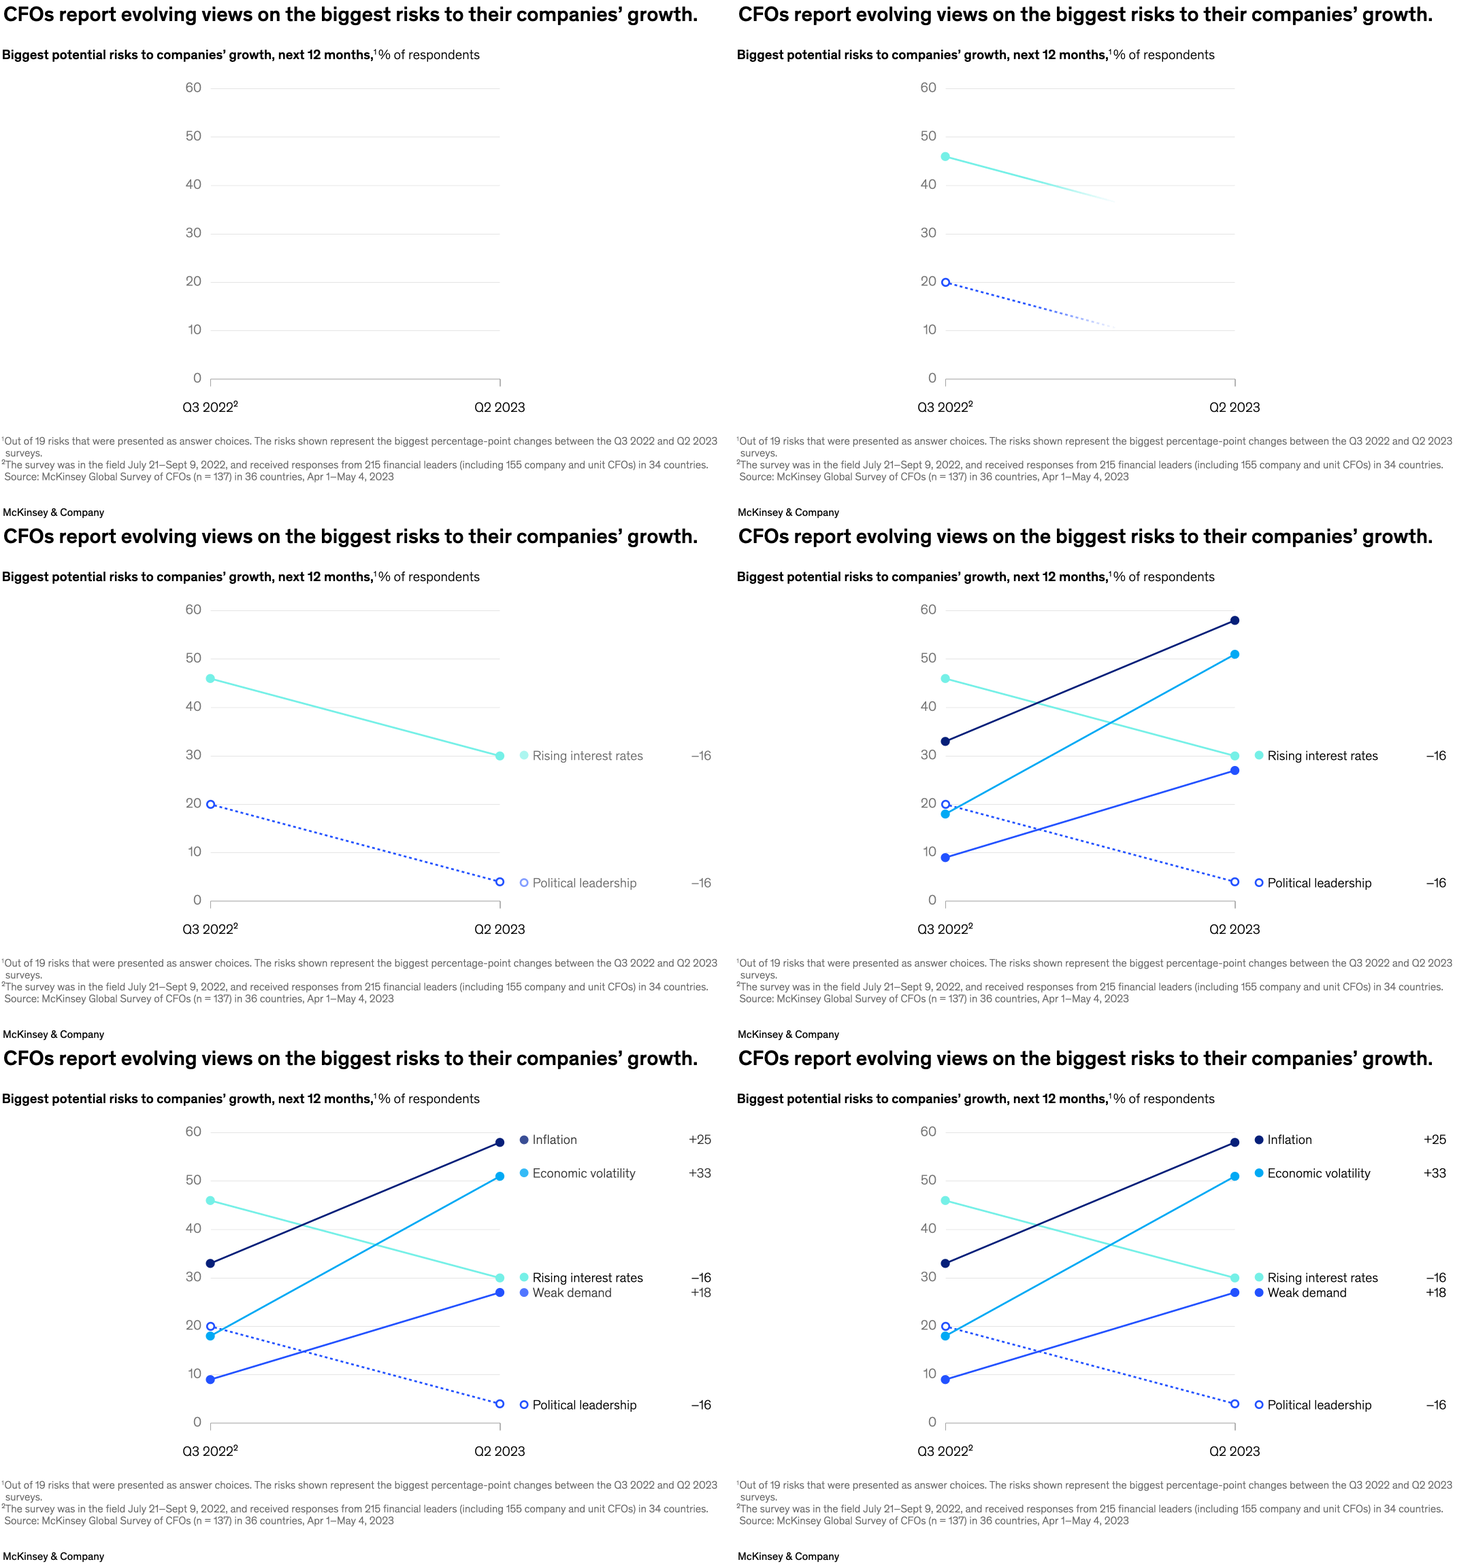
August 14, 2023 – What keeps many CFOs up at night? Inflation, according to our latest CFO pulse survey. Partner Ankur Agrawal and colleagues find that inflation displaced rising interest rates at the top of the list of the biggest potential risks to companies’ growth, up 25 percentage points from our Q3 2022 survey. Concerns over economic volatility and weak demand have also spiked.
To read the survey, see “In the face of volatility, CFOs—and their organizations—adapt,” July 7, 2023.
customizer here
Visual form
Multi-line change chart.
Layout / body structure
A single chart spans two survey points from left to right, so the reader follows each risk line across the gap between Q3 2022 and Q2 2023.
What is being compared
It compares how CFOs rank the biggest potential risks to their companies’ growth across the two survey waves.
Measurement system
The measure is percent of respondents, shown on a vertical scale that runs up to 60, with each line indicating how a particular risk category moves over time.
Visible structure inside the graphic
The plot uses paired time anchors, connecting lines, and risk labels to emphasize ranking shifts rather than one-period snapshots.
Main takeaway from the visual
The chart is organized to show inflation moving to the front of the risk set while other macro pressures such as volatility and weak demand also climb into sharper view.
Key standout values or extremes
The scale reaches 60 percent, and the most prominent line finishes in the upper half of that range, clearly above the lower-ranked concerns.
Controls / sequence, when applicable
This is a static chart image with no in-chart controls to operate.
Companion media, when applicable
There is no separate companion audio or video; the chart image is the full visual on this page.