Source page: McKinsey & Company
Commentary
Insuring the insurers
Investing | Risk | Financial services
July 12, 2023 – Insurers and reinsurers are reassessing their risk tolerance in the face of increasingly frequent and severe catastrophes, new types of risk, and rising interest rates. But a surge of alternative capital—such as hedge funds, sovereign wealth funds, pensions, and mutual funds—into the $560 billion reinsurance market could reshape how insurers approach capital management strategy. Partners Rajiv Dattani and Shannon Varney note that these investments are lowering the cost of capital for insurers and helping tamp down coverage rate increases after natural disasters.
To read the article, see “Alternative capital in property and casualty: A way forward,” May 30, 2023.
customizer here
Visual form
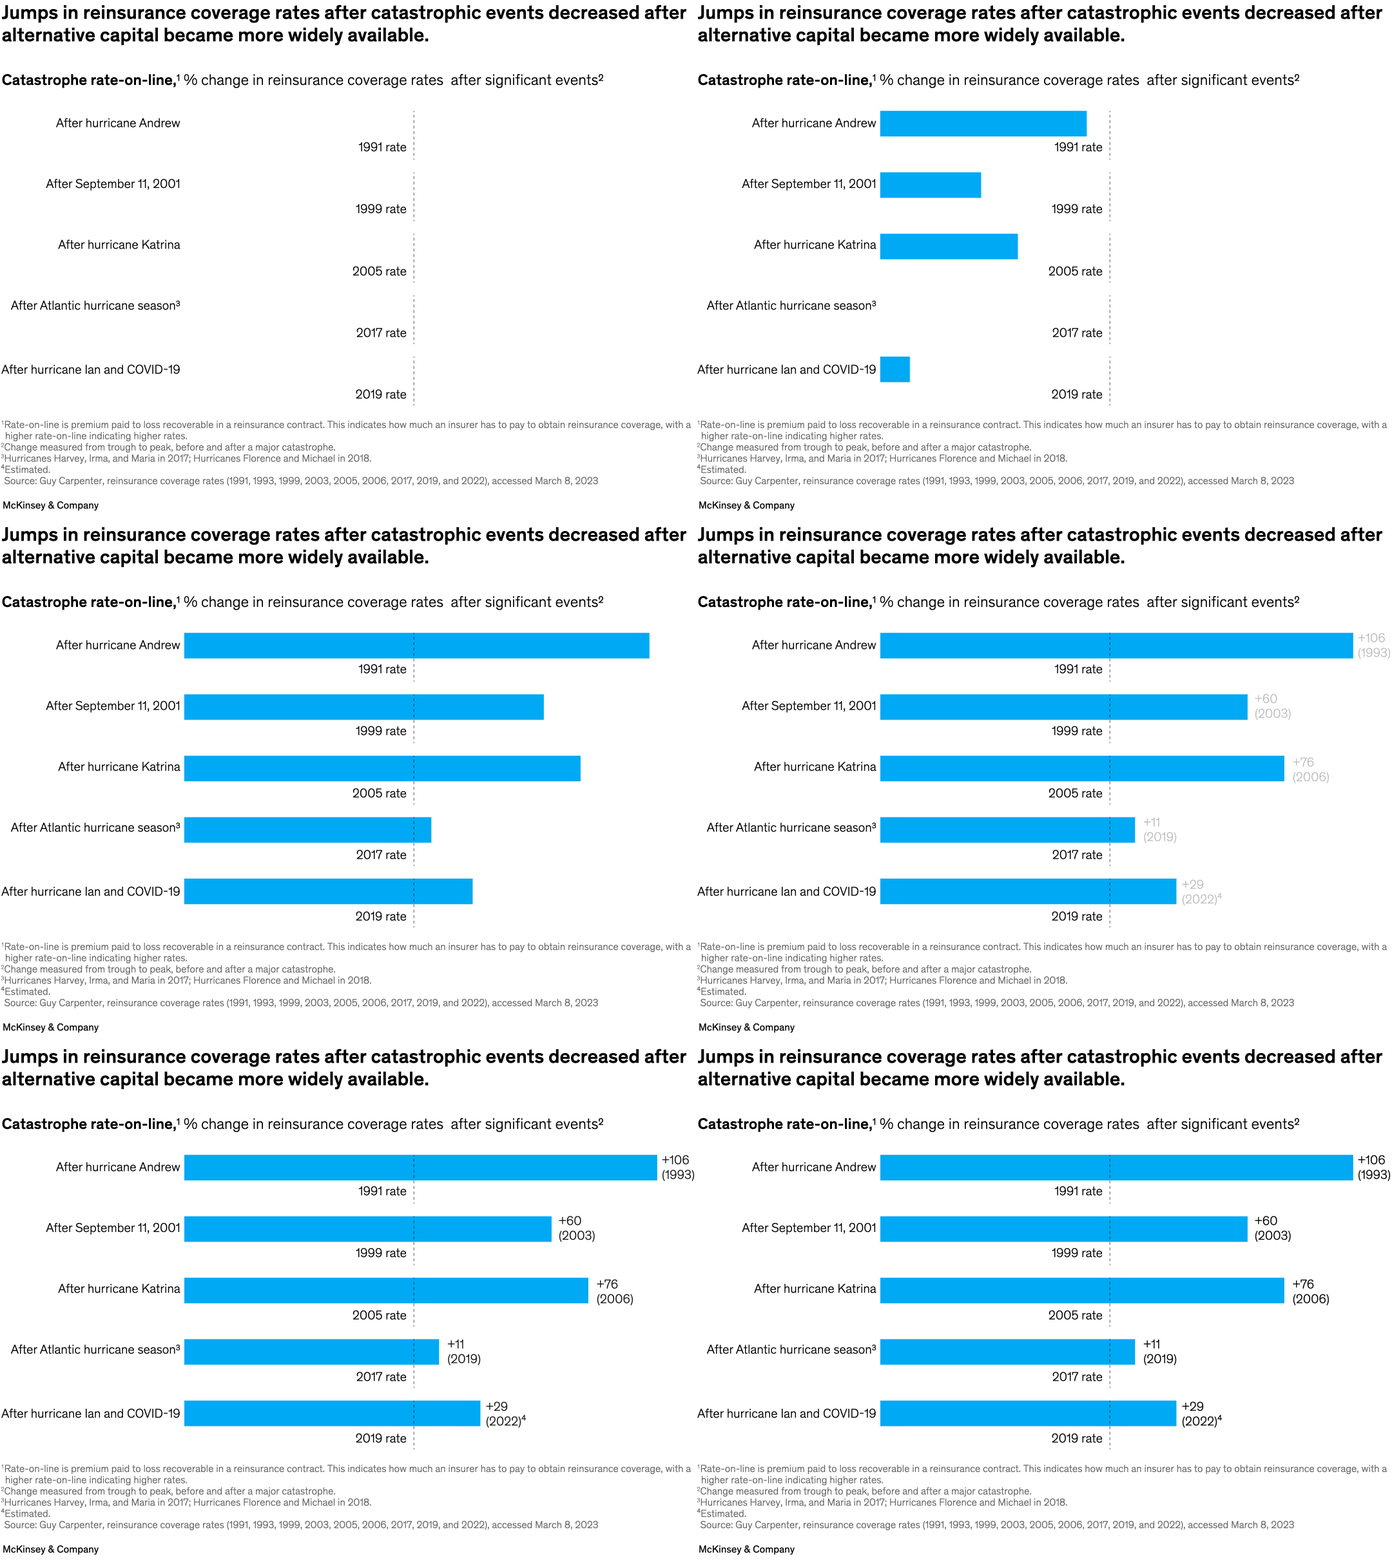
Event-comparison point chart.
Layout / body structure
A single event list runs from top to bottom, and each catastrophe row is aligned against the same central reference so the reader can compare one post-event rate jump to the next.
What is being compared
It compares changes in catastrophe rate-on-line after major events, including Hurricane Andrew, September 11, Hurricane Katrina, the Atlantic hurricane season, and Hurricane Ian and COVID-19, each against the pre-event rate for that row.
Measurement system
The measure is percentage change in reinsurance coverage rates after significant events, with the chart also printing the reference-rate year beside each row, such as 1991, 1999, 2005, 2017, and 2019.
Visible structure inside the graphic
Event labels sit on the left, a dashed vertical reference line anchors the center, and each row carries its own signed change callout so the older and newer catastrophe shocks can be scanned in one column.
Main takeaway from the visual
The rows show that the biggest rate jumps are concentrated in the older catastrophe episodes, while the more recent rows sit much closer to the center reference, which is the visual signal that post-event repricing has moderated.
Key standout values or extremes
The most prominent printed changes are 106, 60, and 76 in the older event rows, while the later rows shrink to much smaller figures such as 11 and 29, making the compression in post-event jumps visible at a glance.
Controls / sequence, when applicable
This is a static chart image with no in-chart controls to operate.
Companion media, when applicable
There is no separate companion audio or video; the chart image is the full visual on this page.