Source page: McKinsey & Company
Commentary
Investments in innovation have slowed during the pandemic
COVID-19 | Strategy
July 6, 2020 – Executives have prioritized efficiency and keeping their core business secure and stable over innovation. They expect to reprioritize innovation when the crisis passes, but will it be too late?
To read the article, see “Innovation in a crisis: Why it is more critical than ever,” June 17, 2020.
customizer here
Visual form
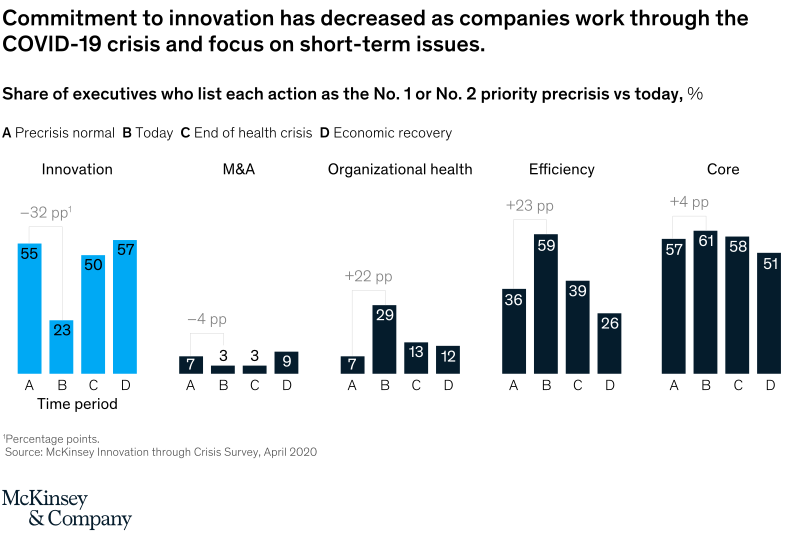
Bar Chart: grouped priority bars for executive investment focus before, during, and after the crisis.
Layout / body structure
Bars are grouped under innovation, M&A, organizational health, efficiency, and core. Within each group, separate bars compare the precrisis normal, today, the end of the health crisis, and economic recovery.
What is being compared
It compares which actions executives ranked as their number one or number two priority across four time horizons. The chart shows how innovation, efficiency, organizational health, M&A, and core-business priorities moved as the pandemic changed management focus.
Measurement system
Bars show percent of executives selecting each action as a top-two priority. Percentage-point callouts highlight the change from the precrisis normal to today.
Visible structure inside the graphic
Innovation drops sharply from the precrisis bar to the today bar, while efficiency and organizational health rise. Core priorities stay high across the displayed periods, and the future bars suggest innovation is expected to recover later.
Main takeaway from the visual
The chart shows that companies pulled attention away from innovation during the crisis and redirected it toward near-term operating needs. The risk is that delaying innovation may leave firms weaker in the recovery period.
Key standout values or extremes
Innovation falls from 55 percent precrisis to 23 percent today, a 32 percentage-point drop. Efficiency rises from 36 percent to 59 percent, and organizational health rises from 7 percent to 29 percent.
Controls / sequence, when applicable
This is a static grouped bar chart; there are no in-chart controls to operate.
Companion media, when applicable
There is no separate companion audio or video; the grouped bar chart is the full visual on this page.