Source page: McKinsey & Company
Commentary
Investors boldly spending on space ventures
Aerospace | Technology
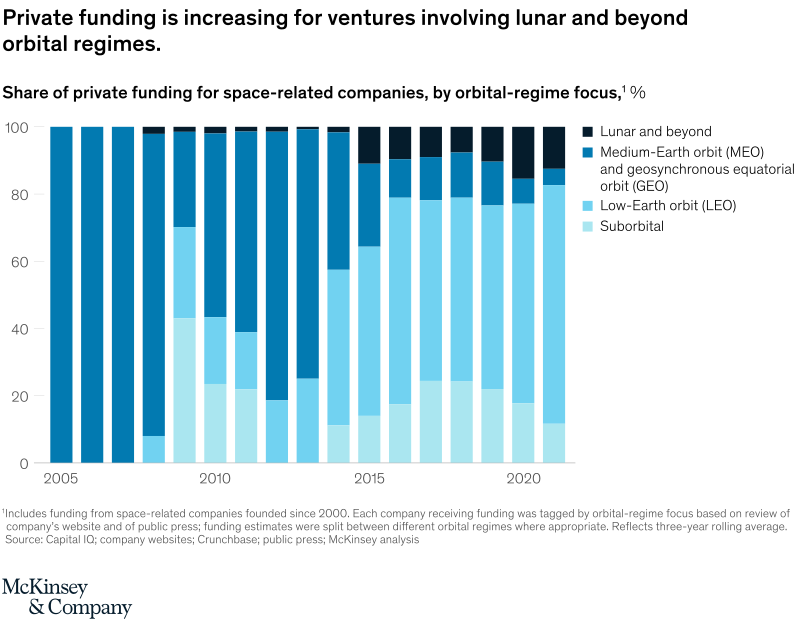
February 17, 2022 – For about a decade, investors have funneled money into small satellites and other ventures in low-Earth orbit. Now investors are thinking bigger and broader, aiming for lunar orbits and beyond. Government and commercial interests account for up to 15 percent of private investments in space ventures, at about $1 billion. That’s a giant leap from the less than 5 percent investors spent on lunar and beyond ten years ago.
To read the article, see “Space: Investment shifts from GEO to LEO and now beyond,” January 27, 2022.
customizer here
Visual form
Stacked area chart.
Layout / body structure
The chart is a single stacked share chart running from the mid-2000s to 2020. Reader moves left to right through time while watching the orbital-regime bands change thickness within the 100 percent stack.
What is being compared
The chart compares the share of private funding for space-related companies by orbital-regime focus: suborbital, low-Earth orbit, medium-Earth orbit and geosynchronous equatorial orbit, and lunar and beyond. It is comparing where investor attention is going inside the space economy over time.
Measurement system
The vertical scale is percent share of private funding, so the stacked bands sum to 100 percent at each point in time. The horizontal axis marks the years from 2005 through 2020, and the chart uses a three-year rolling average rather than one isolated annual reading.
Visible structure inside the graphic
Each orbital regime is represented as a colored band inside the stack, with low-Earth orbit occupying the largest portion for much of the period and the lunar-and-beyond layer widening later in the chart. The labels are written directly against the stack, which makes the band ordering and the changing mix easy to follow without a separate legend.
Main takeaway from the visual
Private funding is broadening beyond the historically dominant low-Earth-orbit segment, with lunar and beyond taking a larger share by the end of the series. The widening top band is the clearest visual sign that investor interest is moving outward in orbital ambition rather than staying concentrated in the lower orbit layer alone.
Key standout values or extremes
The chart’s clearest extreme is the dominant low-Earth-orbit share through much of the timeline, contrasted with the later rise of the lunar-and-beyond band near 2020. The whole visual is framed as a 100 percent stack, so the key movement is the change in share composition rather than a single raw funding total.
Controls / sequence, when applicable
This is a static chart image with no in-chart controls to operate.
Companion media, when applicable
There is no separate companion audio or video; the chart image is the full visual on this page.