Source page: McKinsey & Company
Commentary
It pays to be a technology leader in the semiconductor industry
COVID-19 | Semiconductors
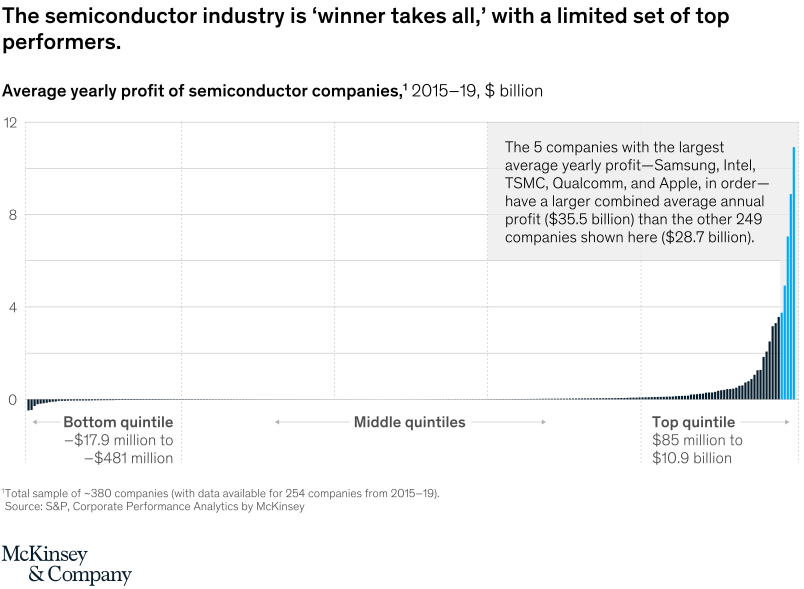
August 25, 2020 – Of the 254 semiconductor companies for which there were data available, five made more combined average annual profit than the remaining 249 did.
To read the article, see “Semiconductor design and manufacturing: Achieving leading-edge capabilities,” August 20, 2020.
customizer here
Visual form
Ranked distribution bar chart of semiconductor company profits.
Layout / body structure
Companies are sorted from bottom quartile through middle quartiles to top quartile. A shaded callout highlights the five largest average yearly profit performers.
What is being compared
It compares average yearly profit among semiconductor companies from 2015 to 2019.
Measurement system
The vertical axis is average yearly profit in billions of dollars. The bottom and top quartile annotations also include profit ranges.
Visible structure inside the graphic
Most companies sit near zero, while a small number of top performers rise sharply on the far right. The top five bars tower over the rest of the distribution.
Main takeaway from the visual
The semiconductor industry is winner-takes-all: a limited set of technology leaders capture disproportionate profits.
Key standout values or extremes
The callout says the five companies with the largest average yearly profit together have 35.5 billion dollars of combined annual profit, exceeding the other 249 companies’ 28.7 billion dollars.
Controls / sequence, when applicable
This is a static chart image with no in-chart controls to operate.
Companion media, when applicable
There is no separate companion audio or video; the chart image is the full visual on this page.