Source page: McKinsey & Company
Commentary
It’s quicker to build inventories than factories
Supply Chain Management | COVID-19 | Resilience
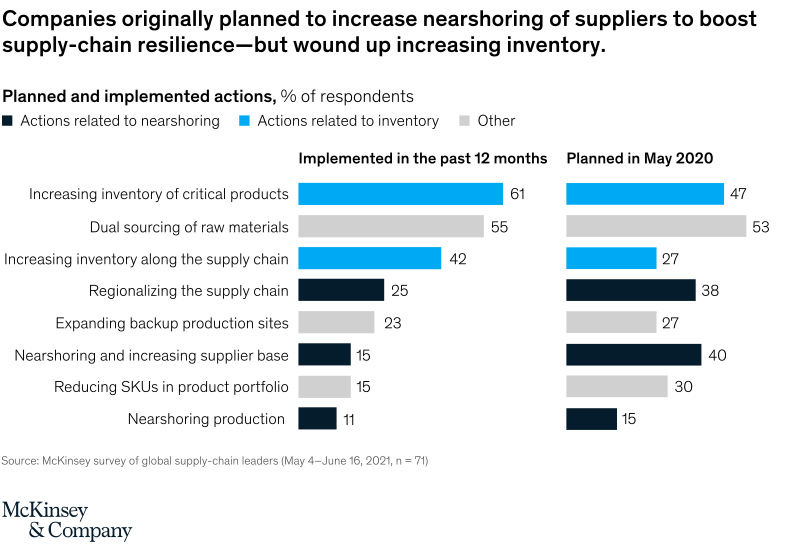
January 4, 2022 – The supply-chain woes choking world trade are well known. But what are companies doing about it? We surveyed leaders in May 2020 and again in 2021. While companies originally planned a host of actions, the leading response by far has been to build inventories.
To read the article, see “How COVID-19 is reshaping supply chains,” November 23, 2021.
customizer here
Visual form
Two-column horizontal bar comparison chart.
Layout / body structure
The chart is divided into two side-by-side columns: actions implemented in the past 12 months on the left and actions originally planned in May 2020 on the right. Each action occupies the same row across both columns, so the reader can scan left-to-right within a row to compare what companies said they would do with what they actually did.
What is being compared
The chart compares planned and implemented supply-chain resilience actions. It contrasts inventory-related actions, nearshoring-related actions, and other actions across the same list of interventions.
Measurement system
The bars are measured as percent of respondents and are directly labeled with their values. Color encodes the action family: dark for nearshoring, bright blue for inventory, and light gray for other.
Visible structure inside the graphic
The left column shows implemented actions such as increasing inventory of critical products, dual sourcing, increasing inventory along the supply chain, regionalizing the supply chain, and nearshoring production. The right column repeats the same actions for the earlier plan set, making the inventory bars and nearshoring bars easy to compare row by row.
Main takeaway from the visual
Companies ended up leaning much more heavily on inventory than on the nearshoring moves they originally expected to make. The inventory bars are stronger on the implemented side, while several nearshoring bars are much larger on the planned side, showing that inventory became the quicker resilience lever.
Key standout values or extremes
Increasing inventory of critical products rises to 61 percent implemented versus 47 percent planned, and increasing inventory along the supply chain rises to 42 versus 27 percent. By contrast, nearshoring and increasing supplier base falls to 15 percent implemented from 40 percent planned, and regionalizing the supply chain falls to 25 from 38 percent.
Controls / sequence, when applicable
This is a static chart image with no in-chart controls to operate.
Companion media, when applicable
There is no separate companion audio or video; the chart image is the full visual on this page.