Source page: McKinsey & Company
Commentary
Jobs aren’t what they used to be
COVID-19 | Economic Development | North America
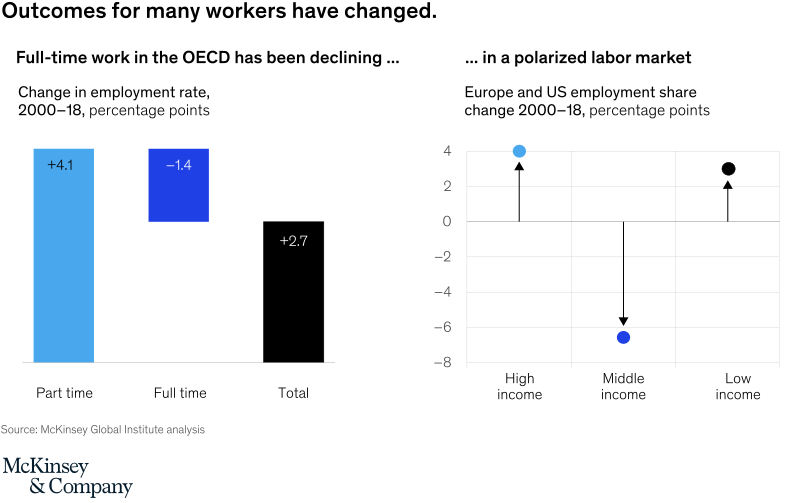
March 12, 2021 – Full-time middle-income jobs are disappearing. High- and low-income jobs are on the rise. #America2021
To read the article, see “America 2021: Rebuilding lives and livelihoods after COVID-19,” February 16, 2021.
customizer here
Visual form
Two-panel comparison chart combining bars and a dot plot.
Layout / body structure
The chart places a simple three-bar summary on the left and a three-category dot plot on the right. Reader takes the left panel first to see the split between part-time, full-time, and total employment-rate change, then moves right to the polarized labor-market view across high-, middle-, and low-income groups.
What is being compared
It compares labor-market outcomes in two ways: first, the change in employment rate for part-time work, full-time work, and total work in the OECD from 2000 to 2018; second, the change in employment share for Europe and the United States across high-, middle-, and low-income groups over the same period.
Measurement system
Both panels use percentage-point change. The left panel prints the exact bar values, while the right panel uses positioned markers against a vertical scale from positive gains above zero to losses below zero, with separate markers for Europe and the United States in each income band.
Visible structure inside the graphic
The left panel uses three isolated bars so the increase in part-time work and the decline in full-time work stand apart immediately. The right panel reduces the comparison to three income columns with paired markers, making the eye jump from gains at the high- and low-income ends to a deep drop in the middle-income category.
Main takeaway from the visual
Employment growth over this period did not spread evenly across job types or income bands. Part-time work expanded while full-time work fell, and the right-hand panel shows a polarized pattern in which high- and low-income employment shares rise while middle-income share drops sharply.
Key standout values or extremes
The left panel shows part-time employment up 4.1 percentage points, full-time employment down 1.4 points, and total employment up 2.7 points. In the right panel, the high-income share rises by about 3 to 4 points and the low-income share by about 2 to 3 points, while the middle-income share falls the most at roughly 6 to 7 percentage points.
Controls / sequence, when applicable
This is a static chart image with no in-chart controls to operate.
Companion media, when applicable
There is no separate companion audio or video; the chart image is the full visual on this page.