Source page: McKinsey & Company
Commentary
Just 6 percent of the writers, directors, and producers in US-produced films are Black
Diversity & Inclusion | Entertainment
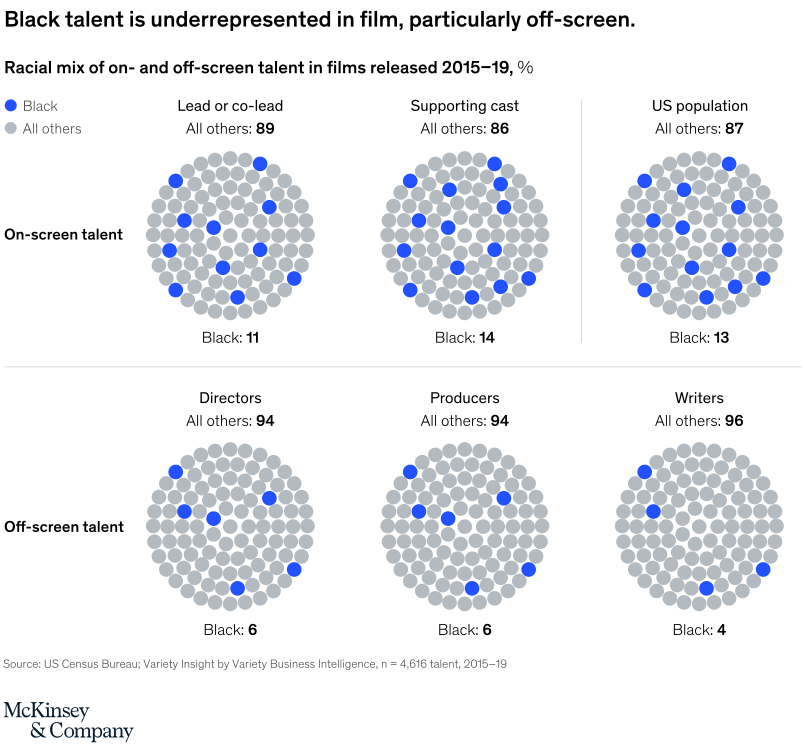
April 2, 2021 – Black talent is underrepresented both on- and off-screen, but particularly in positions of creative control.
To read the article, see “Black representation in film and TV: The challenges and impact of increasing diversity,” March 11, 2021.
customizer here
Visual form
Six-panel dot-matrix comparison chart.
Layout / body structure
The chart is arranged as a two-row grid of circular dot matrices. The top row compares lead or co-lead roles, supporting cast, and the US population, and the bottom row compares directors, producers, and writers, so the reader moves across on-screen representation first and then across off-screen roles.
What is being compared
It compares the racial mix of on-screen and off-screen talent in films released from 2015 to 2019, specifically the share of Black talent versus all others across lead or co-lead roles, supporting cast, directors, producers, writers, and the benchmark of the US population.
Measurement system
Each panel functions like a 100-dot icon array. Blue dots represent Black talent and gray dots represent all others, with the exact shares printed as Black and All others beneath or above each circle.
Visible structure inside the graphic
All six panels use the same circular dot field, which keeps the scale consistent across every role. The on-screen circles in the top row have visibly more blue dots than the off-screen circles in the bottom row, and the US population panel provides the benchmark against which the role-specific panels can be judged.
Main takeaway from the visual
Black talent is present on-screen at roughly population-like levels in some roles but is much more underrepresented in off-screen creative leadership roles. The starkest drop appears in writers, directors, and producers, where the blue dots thin out sharply compared with both the supporting-cast panel and the US population benchmark.
Key standout values or extremes
Lead or co-lead roles show Black representation at 11 percent versus 89 percent all others, supporting cast at 14 versus 86, and the US population benchmark at 13 versus 87. Off-screen roles are lower: directors are 6 percent Black, producers 6 percent, and writers only 4 percent, making writers the sparsest blue-dot panel on the page.
Controls / sequence, when applicable
This is a static chart image with no in-chart controls to operate.
Companion media, when applicable
There is no separate companion audio or video; the chart image is the full visual on this page.