Source page: McKinsey & Company
Commentary
Layaway 2.0: Take home now, pay later with no interest fees
Financial services | Payments
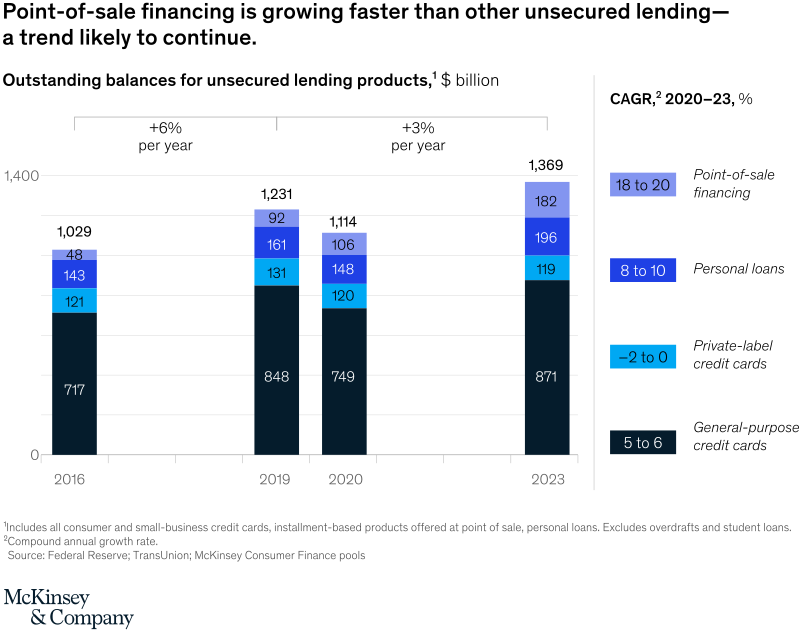
August 17, 2021 – You’ve seen the offers, online and in stores: pay now, or pay later in four easy installments. Our research finds that this innovation, point-of-sale financing, is growing much faster than traditional unsecured lending. The new services are diverting some $8 to $10 billion annually from banks’ revenues.
To read the article, see “Buy now, pay later: Five business models to compete,” July 29, 2021.
customizer here
Visual form
Stacked column chart with a side CAGR legend.
Layout / body structure
The chart is a single sequence of four stacked columns for 2016, 2019, 2020, and 2023, plus a right-hand legend block for growth rates. Read the columns left to right across time and then use the side legend to compare the category-specific CAGR ranges.
What is being compared
The chart compares outstanding balances across four unsecured lending products over time: general-purpose credit cards, private-label credit cards, personal loans, and point-of-sale financing. It is also comparing how fast each product category is expected to grow between 2020 and 2023.
Measurement system
The vertical scale measures balances in billions of dollars. Each stack segment is color-coded by product type, the total balance is printed above each column, and the right-hand legend reports CAGR ranges in percent for each category from 2020 to 2023.
Visible structure inside the graphic
Each year is shown as a stacked bar with the dark base for general-purpose credit cards, a cyan slice for private-label cards, a royal-blue slice for personal loans, and a lavender top slice for point-of-sale financing. Above the bars, bracket labels summarize overall annual growth periods, while the right side aligns color chips with CAGR ranges and category names.
Main takeaway from the visual
Point-of-sale financing is visibly the smallest segment in the stack, but it is the fastest-growing slice and expands meaningfully by 2023. The dominant base remains general-purpose credit cards, yet the chart makes the most aggressive growth story the lighter top segment rather than the biggest category.
Key standout values or extremes
Total balances rise from 1,029 in 2016 to 1,231 in 2019, dip to 1,114 in 2020, and rebound to 1,369 in 2023. Within the 2023 stack, general-purpose credit cards contribute 871, personal loans 196, private-label credit cards 119, and point-of-sale financing 182. The side legend shows point-of-sale financing with the highest CAGR at 18 to 20 percent, while private-label credit cards are the weakest at negative 2 to 0 percent.
Controls / sequence, when applicable
This is a static chart image with no in-chart controls to operate.
Companion media, when applicable
There is no separate companion audio or video; the chart image is the full visual on this page.