Source page: McKinsey & Company
Commentary
Lean on me
Work-life balance | Inequality
January 14, 2022 – Women are doing the lion’s share of the emotional labor at work, providing support for colleagues and checking in on others’ well-being. The already frayed social fabric in organizations could unravel more quickly as the result of burnout and other work–life challenges if women continue to drop from the workforce.
To read the article, see “Married to the job no more: Craving flexibility, parents are quitting to get it,” December 3, 2021.
customizer here
Visual form
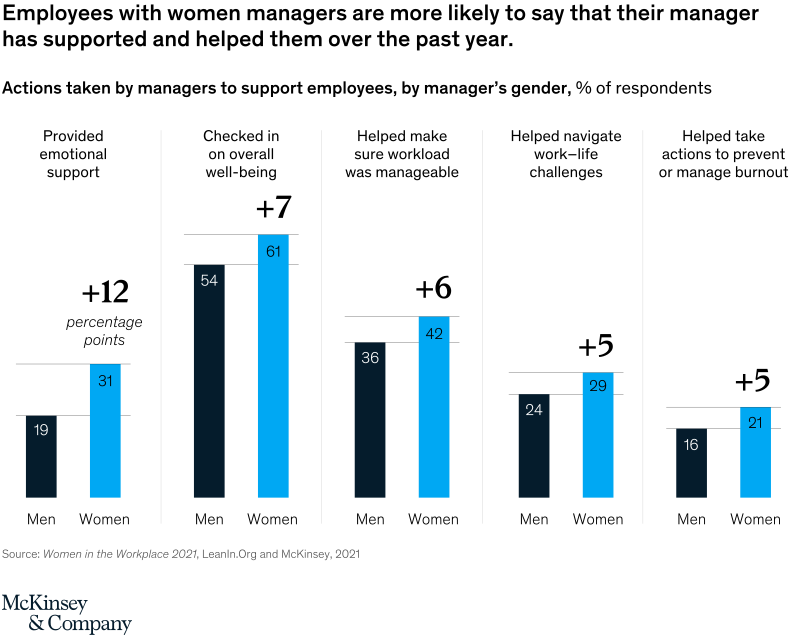
Five-panel grouped bar chart.
Layout / body structure
The chart is arranged as five side-by-side bar groups, each focused on one manager-support behavior. In every group the reader compares the men-manager bar with the women-manager bar, then moves to the next support category across the row.
What is being compared
The chart compares the share of employees who say their manager took specific supportive actions over the past year. It compares managers who are men with managers who are women across emotional support, well-being check-ins, workload manageability, help with work-life challenges, and action to prevent or manage burnout.
Measurement system
The vertical measure is percent of respondents, with direct values printed on the bars and percentage-point gap labels printed above each pair. The categories themselves provide the horizontal grouping structure rather than a numeric x-axis.
Visible structure inside the graphic
Each category has a pair of vertical bars: a dark bar for men managers and a bright blue bar for women managers. Above each pair, a large gap label such as +12, +7, +6, or +5 percentage points summarizes the difference, making the visual easy to scan category by category.
Main takeaway from the visual
Employees with women managers report more support across every behavior shown. The blue bar is taller in all five groups, so the page reads as a consistent across-the-board advantage rather than a one-category exception.
Key standout values or extremes
Women managers lead by 12 points on providing emotional support, with 31 percent versus 19 percent for men managers. They also lead 61 to 54 on well-being check-ins, 42 to 36 on helping make workload manageable, 29 to 24 on navigating work-life challenges, and 21 to 16 on preventing or managing burnout.
Controls / sequence, when applicable
This is a static chart image with no in-chart controls to operate.
Companion media, when applicable
There is no separate companion audio or video; the chart image is the full visual on this page.