Source page: McKinsey & Company
Commentary
Life sciences’ capital conundrum
Life Sciences | Pharmaceuticals & Medical Products
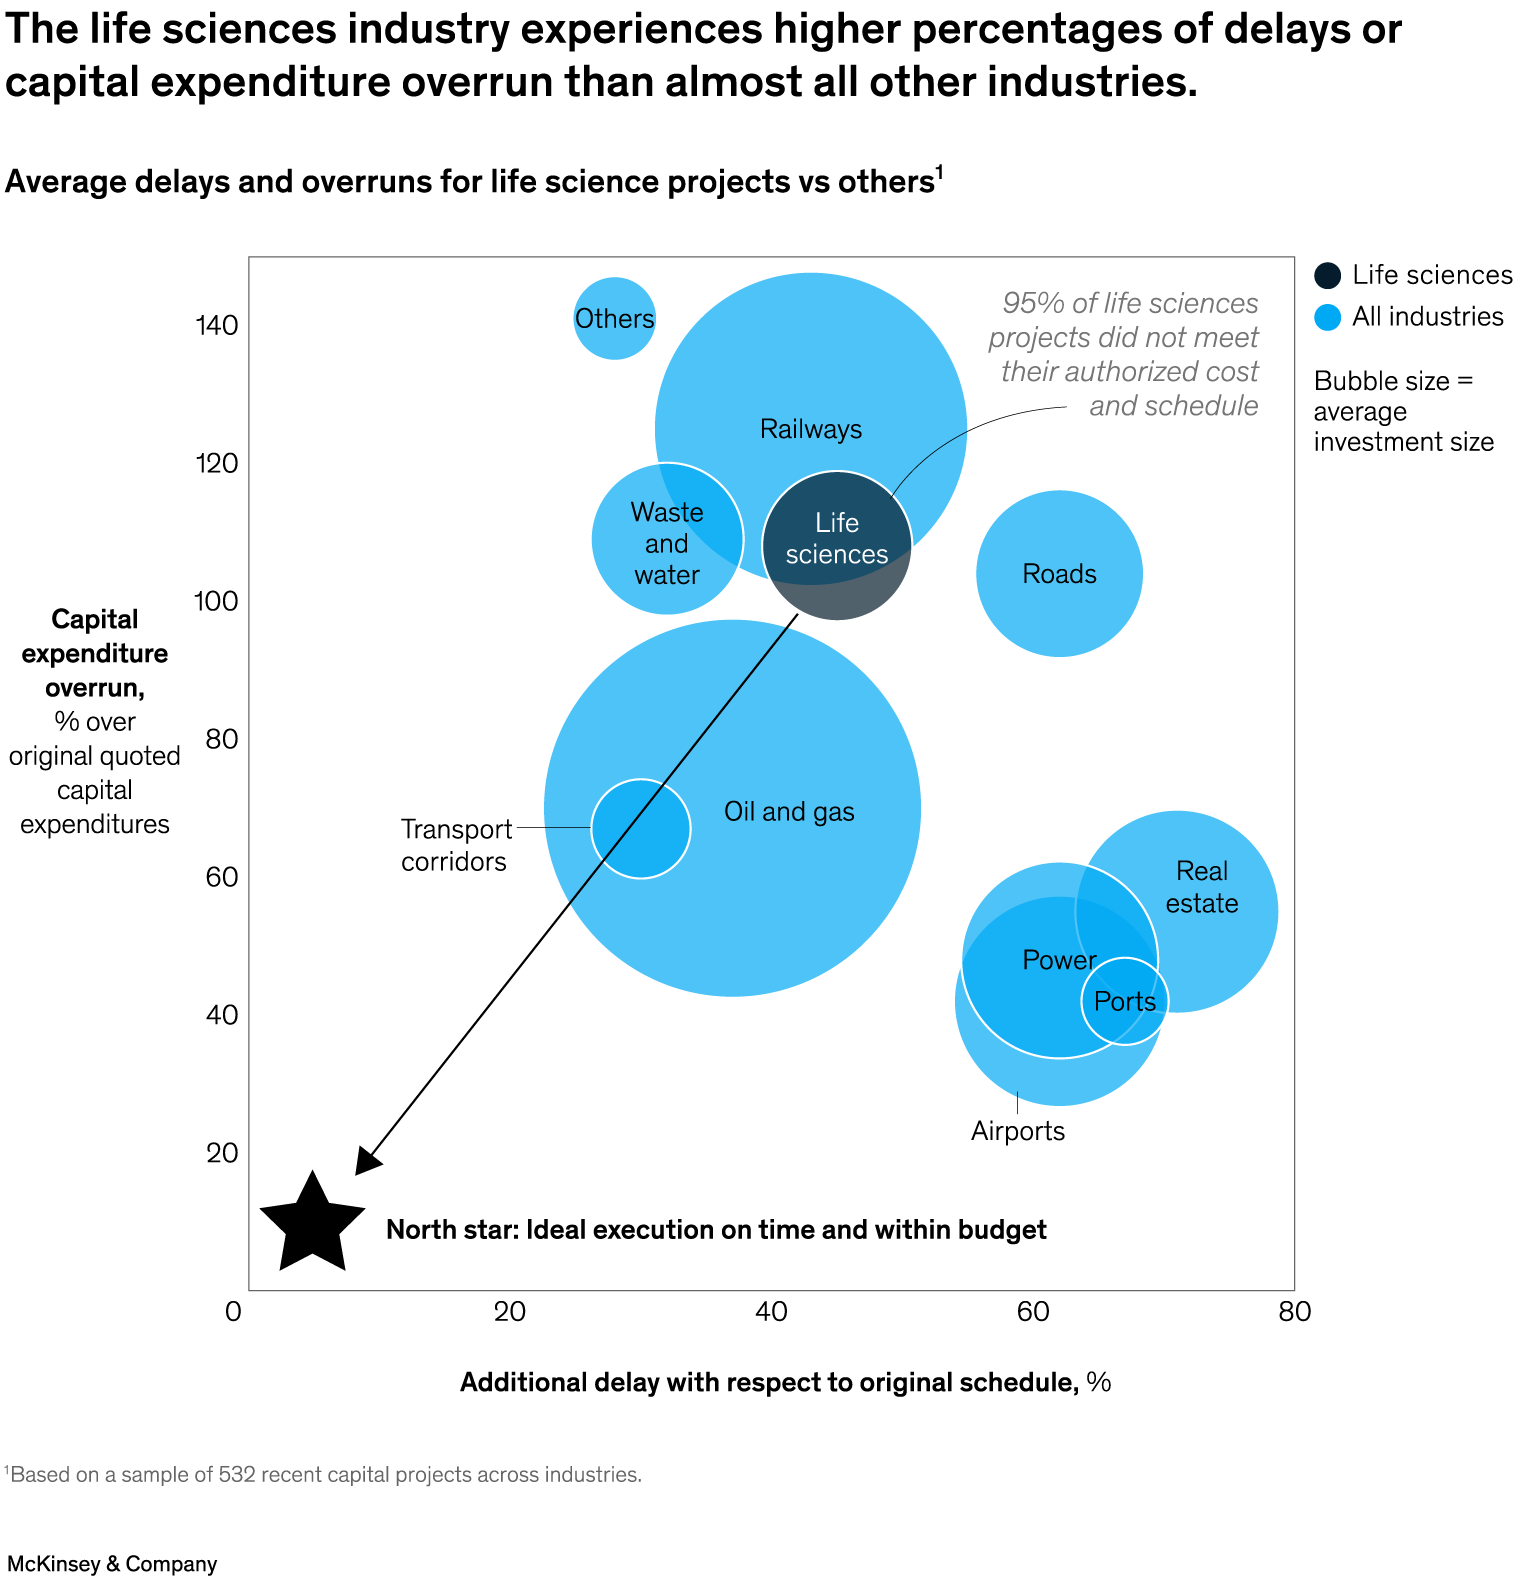
September 24, 2025 – The life sciences industry has seen a surge in capital, and firms have announced more than $150 billion in new capital projects before 2030. However, capital alone doesn’t guarantee success, note Senior Partner Parag Patel and coauthors. Some 95 percent of life sciences projects exceed their budget and schedule, with the sector overall experiencing a larger proportion of delays or capital expenditure overruns than almost any other industry. Since time to market is crucial for life sciences firms, they can consider adopting a time-based capital strategy by focusing on developing integrated capabilities to enhance delivery speed and reliability without boosting risk or cost variability, rather than just increasing spending.
To read the article, see “The speed-to-market imperative for life sciences capital delivery,” August 4, 2025.
customizer here
Visual form
Bubble scatter plot.
Layout / body structure
It is a single chart read within one x-y plotting area, with a legend on the right, a north-star marker at the lower left, and annotations pointing to the life-sciences bubble. Reader scans left to right for schedule delay and bottom to top for cost overrun.
What is being compared
It compares life sciences capital projects with projects in other industries such as railways, roads, oil and gas, real estate, power, ports, airports, waste and water, and transport corridors. Each bubble represents an industry or comparator group positioned by delay and capital-expenditure overrun.
Measurement system
The horizontal axis measures additional delay relative to the original schedule in percent, and the vertical axis measures capital-expenditure overrun as a percent over original quoted capital expenditures. Bubble size represents average investment size, and color separates life sciences from all industries.
Visible structure inside the graphic
Large and small circles are scattered across the chart area, with a dark life-sciences bubble sitting around the middle-right of the plot and light-blue bubbles marking the comparison industries. The legend in the upper right explains the color coding and reminds the reader that bubble size equals average investment size. A star labeled north star marks the ideal bottom-left position of on-time, on-budget delivery.
Main takeaway from the visual
The chart shows life sciences clustered in a worse execution position than most peers because it sits high on cost overrun and well to the right of the ideal target, with an annotation stating that 95 percent of life sciences projects did not meet authorized cost and schedule.
Key standout values or extremes
Life sciences sits at roughly 45 percent additional delay and about 110 percent capital-expenditure overrun. Railways is even higher on overrun at around 125 percent, but life sciences stands out because the annotation ties the point directly to the 95 percent failure rate. Oil and gas carries the largest bubble on the chart, signaling the biggest average investment size.
Controls / sequence, when applicable
This is a static chart image with no in-chart controls to operate.
Companion media, when applicable
There is no separate companion audio or video; the chart image is the full visual on this page.