Source page: McKinsey & Company
Commentary
Locating racial inequities
Diversity & Inclusion | Public Sector
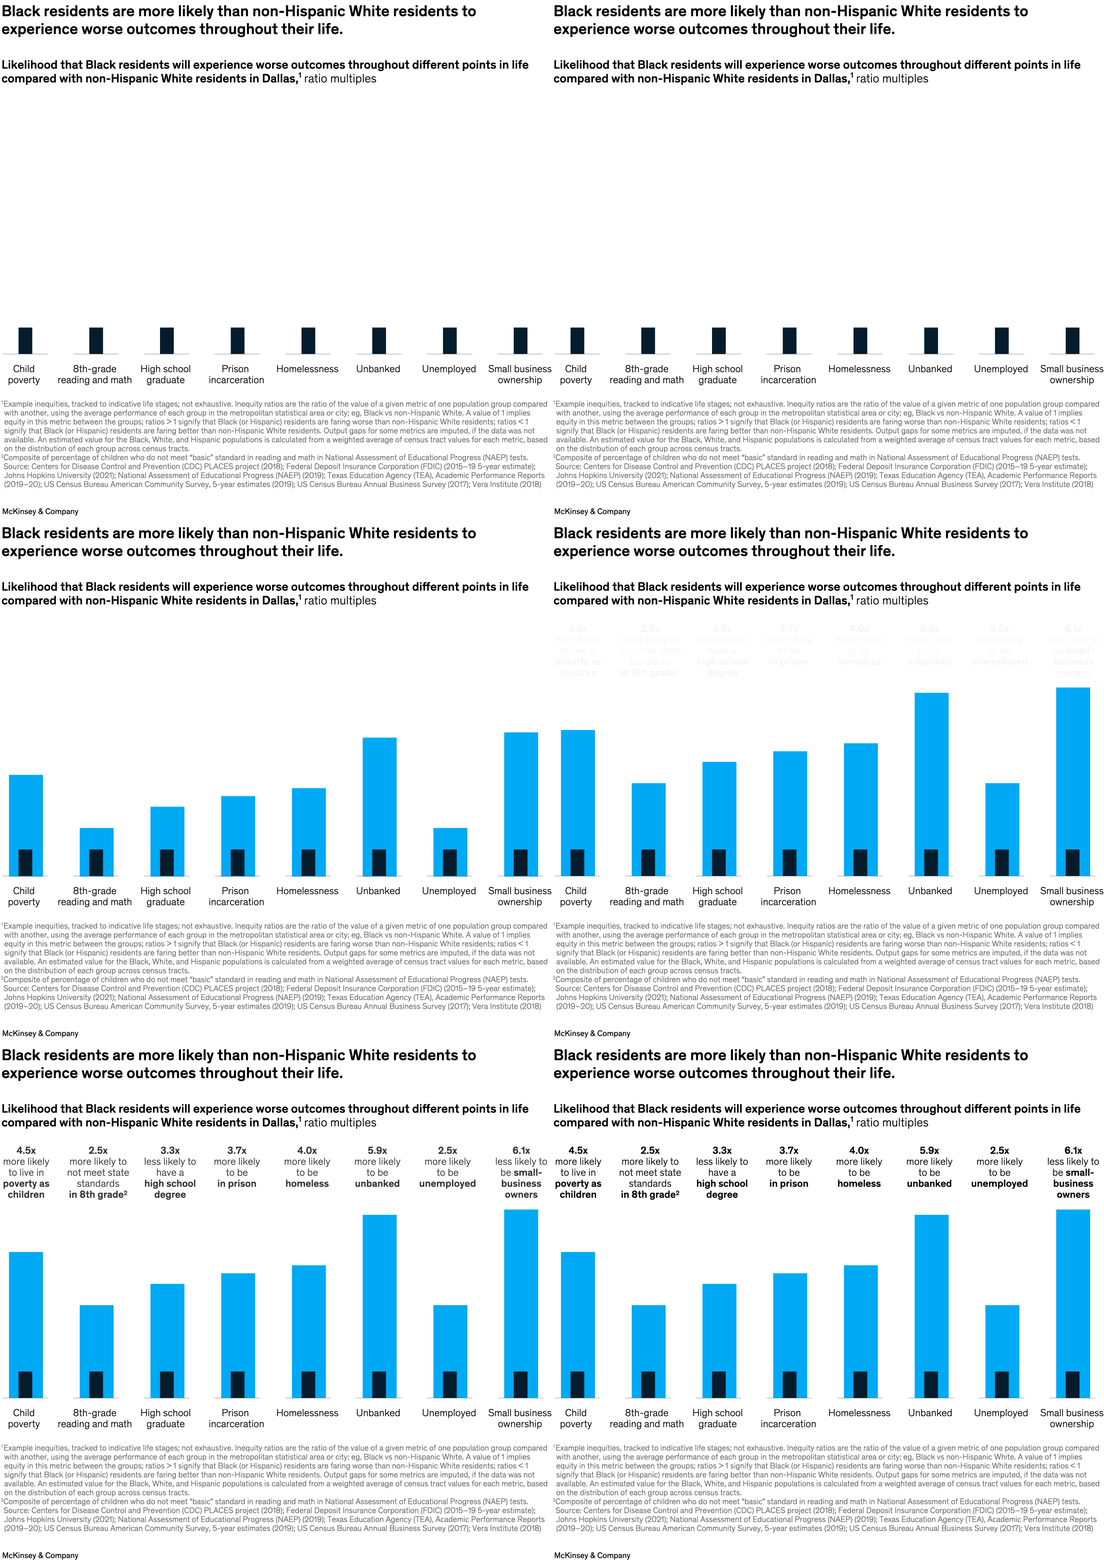
March 21, 2023 – Racial inequality trends are national in scope, but vast differences can exist between states and cities. Senior partners Kweilin Ellingrud and Ramesh Srinivasan and colleagues homed in on neighborhood-level data from eight US cities with large Black and Hispanic populations, finding that, in Dallas, for example, Black children are 4.5 times as likely to live in poverty and are 3.3 times less likely to earn a high school degree than their non-Hispanic White peers.
To read the article, see “Zooming in: Using local insights to inform US racial-equity efforts,” February 27, 2023.
customizer here
Visual form
Vertical bar chart of ratio multiples.
Layout / body structure
The page uses a single chart with eight categories running left to right across different life outcomes. Each category pairs a small baseline marker with a taller blue disparity bar and a ratio label above it.
What is being compared
It compares how Black residents in Dallas fare relative to non-Hispanic White residents across poverty, education, incarceration, homelessness, banking access, employment, and small-business ownership.
Measurement system
The measure is a likelihood multiple, so the reader is tracking how many times more likely or less likely Black residents are to experience a given outcome relative to the white baseline.
Visible structure inside the graphic
Each category uses a compact dark base to anchor the white reference point and a larger blue column above it for the Black-to-white disparity ratio. The ratio labels above the bars make the ranking explicit, with the tallest bars concentrated at the ends of the sequence.
Main takeaway from the visual
The chart shows worse outcomes for Black residents across every stage represented, and the disparities are not marginal. Several outcomes sit at four to six times the white baseline, so the page reads as a chain of compounding inequities rather than one isolated gap.
Key standout values or extremes
The largest disparity is small-business ownership, where Black residents are 6.1 times less likely to be owners. Other large gaps include 5.9 times more likely to be unbanked, 4.5 times more likely to live in poverty as children, 4.0 times more likely to be homeless, and 3.7 times more likely to be in prison.
Controls / sequence, when applicable
This is a static chart image with no in-chart controls to operate.
Companion media, when applicable
There is no separate companion audio or video; the chart image is the full visual on this page.