Source page: McKinsey & Company
Commentary
Luxury's lull
Fashion | Retail
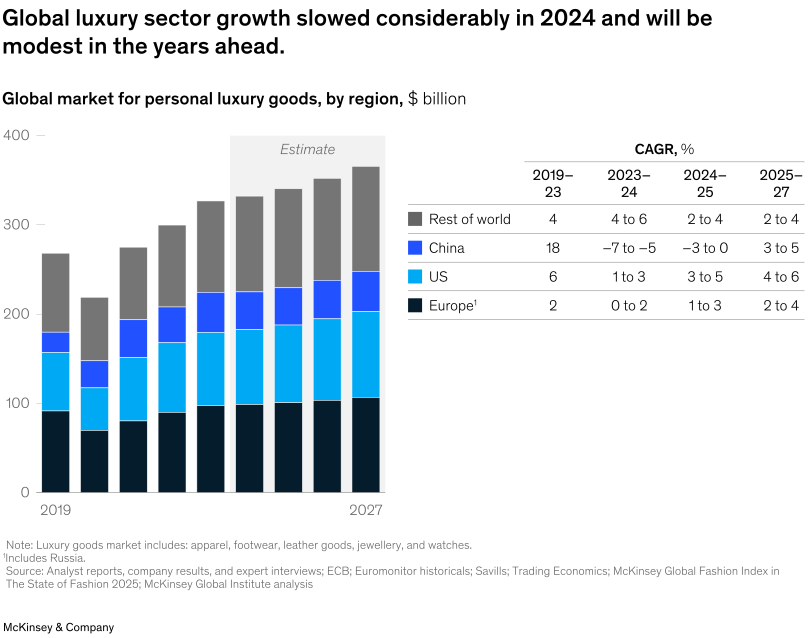
February 12, 2025 – Growth in the global luxury sector declined in 2024, a trend that is expected to continue in the coming years. Although China, the largest market for luxury goods, saw a decline in growth in 2024, it is projected to rebound with positive growth through 2027, Senior Partner Anita Balchandani and coauthors explain. The US luxury market is expected to see steady growth, while Europe’s may be more moderate. Luxury brands may have to try a strategic reset for long-term success.
To read the report, see “The State of Luxury: How to navigate a slowdown,” January 13, 2025.
customizer here
Visual form
Stacked bar chart with a side CAGR table.
Layout / body structure
The chart combines a sequence of annual stacked bars on the left with a CAGR table on the right. Read the bars from 2019 through the 2027 estimate to see the market-size path and regional composition, then use the right-side table to compare growth ranges across regions and forecast windows.
What is being compared
It compares the global market for personal luxury goods over time and across regions, specifically Europe, the United States, China, and the rest of the world. It also compares the changing CAGR outlook across the 2019 to 2023, 2023 to 2024, 2024 to 2025, and 2025 to 2027 periods.
Measurement system
The main chart is measured in billions of dollars, while the table reports CAGR percentages or percentage ranges. Color separates the regional stacks, and total column heights show the overall market level in each year.
Visible structure inside the graphic
The left side is built from stacked annual bars, with an estimated region highlighted over the later years. The right side is a compact table that breaks out CAGR by region and time period, so the chart combines level, mix, and forward growth guidance in one visual.
Main takeaway from the visual
The visual shows that luxury growth slowed sharply in 2024 and that the path forward is expected to be modest rather than explosive. The stacked bars recover and edge higher after the earlier dip, but the CAGR table makes clear that the coming years are forecast to grow at much lower rates than the earlier 2019 to 2023 period.
Key standout values or extremes
China is the clearest weak spot in the short term, moving from an 18 percent CAGR in 2019 to 2023 to a negative 7 to 5 percent range in 2023 to 2024 and still a negative 3 to 0 percent range in 2024 to 2025. By contrast, the US remains positive across the forecast windows at roughly 3 to 5 percent and then 4 to 6 percent, while the total market bars rise from the post-dip low toward the mid-300-billion-dollar range by 2027.
Controls / sequence, when applicable
This is a static chart image with no in-chart controls to operate.
Companion media, when applicable
There is no separate companion audio or video; the chart image is the full visual on this page.