Source page: McKinsey & Company
Commentary
M&A in flux
Corporate finance | M&A
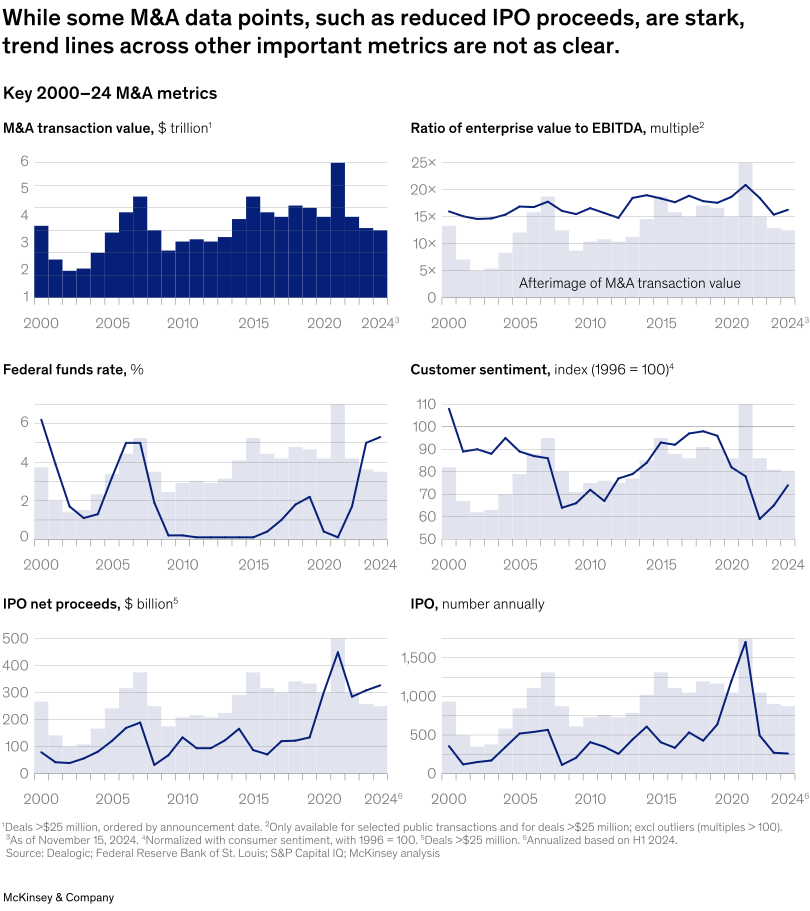
March 20, 2025 – M&A deal counts are falling amid uncertain global economic conditions. M&A transaction values declined after 2021, while the ratio of enterprise value to EBITDA has remained relatively stable, Senior Partner Jake Henry and colleagues explain. Customer sentiment has shown mixed trends postpandemic, and IPO activity experienced a sharp decline since 2021, given shocks to capital markets.
To read the article, see “Uncertainty in M&A: Postcards from the new normal,” February 19, 2025.
customizer here
Visual form
Six-panel small-multiple chart that combines one bar chart with five line charts.
Layout / body structure
The chart is arranged as a 3-by-2 grid. Read the panels left to right and top to bottom: transaction value and enterprise-value multiples on the top row, federal funds rate and consumer sentiment in the middle row, and IPO proceeds and IPO count on the bottom row.
What is being compared
It compares several M&A-related market indicators across the 2000 to 2024 period, including transaction value, valuation multiples, interest rates, consumer sentiment, IPO proceeds, and annual IPO counts. The point is to compare how clearly or unevenly these measures move around the same broad market cycle.
Measurement system
The panels use different units: trillions of dollars for M&A transaction value, EBITDA multiples for valuation, percentage points for the federal funds rate, an index for consumer sentiment, billions of dollars for IPO net proceeds, and annual counts for IPO volume. Each panel has its own axis, so the reader is comparing shapes and turning points rather than raw values on a single shared scale.
Visible structure inside the graphic
The top-left panel is a bar chart, while the other five panels are line charts, several with pale shaded or bar-like afterimages behind the main line. That structure lets the viewer scan repeated time-series shapes across multiple metrics without collapsing them into one crowded plot.
Main takeaway from the visual
The chart shows that some signals are stark while others are noisy or mixed, which is why the chart argues that M&A is in flux rather than pointing to one clean directional story. IPO measures swing dramatically, but sentiment, rates, valuation multiples, and transaction values move with less uniformity across the full period.
Key standout values or extremes
The transaction-value panel reaches about 6 trillion dollars around 2021 before falling back, and the enterprise-value-to-EBITDA line rises above 20 times near the same period. The IPO count panel spikes to roughly 1,700 annual listings around 2021 before dropping sharply, while the federal funds rate collapses toward zero and then climbs back to about 5 percent by 2024.
Controls / sequence, when applicable
This is a static chart image with no in-chart controls to operate.
Companion media, when applicable
There is no separate companion audio or video; the chart image is the full visual on this page.