Source page: McKinsey & Company
Commentary
Make that application shine
North America | Infrastructure | Public Sector
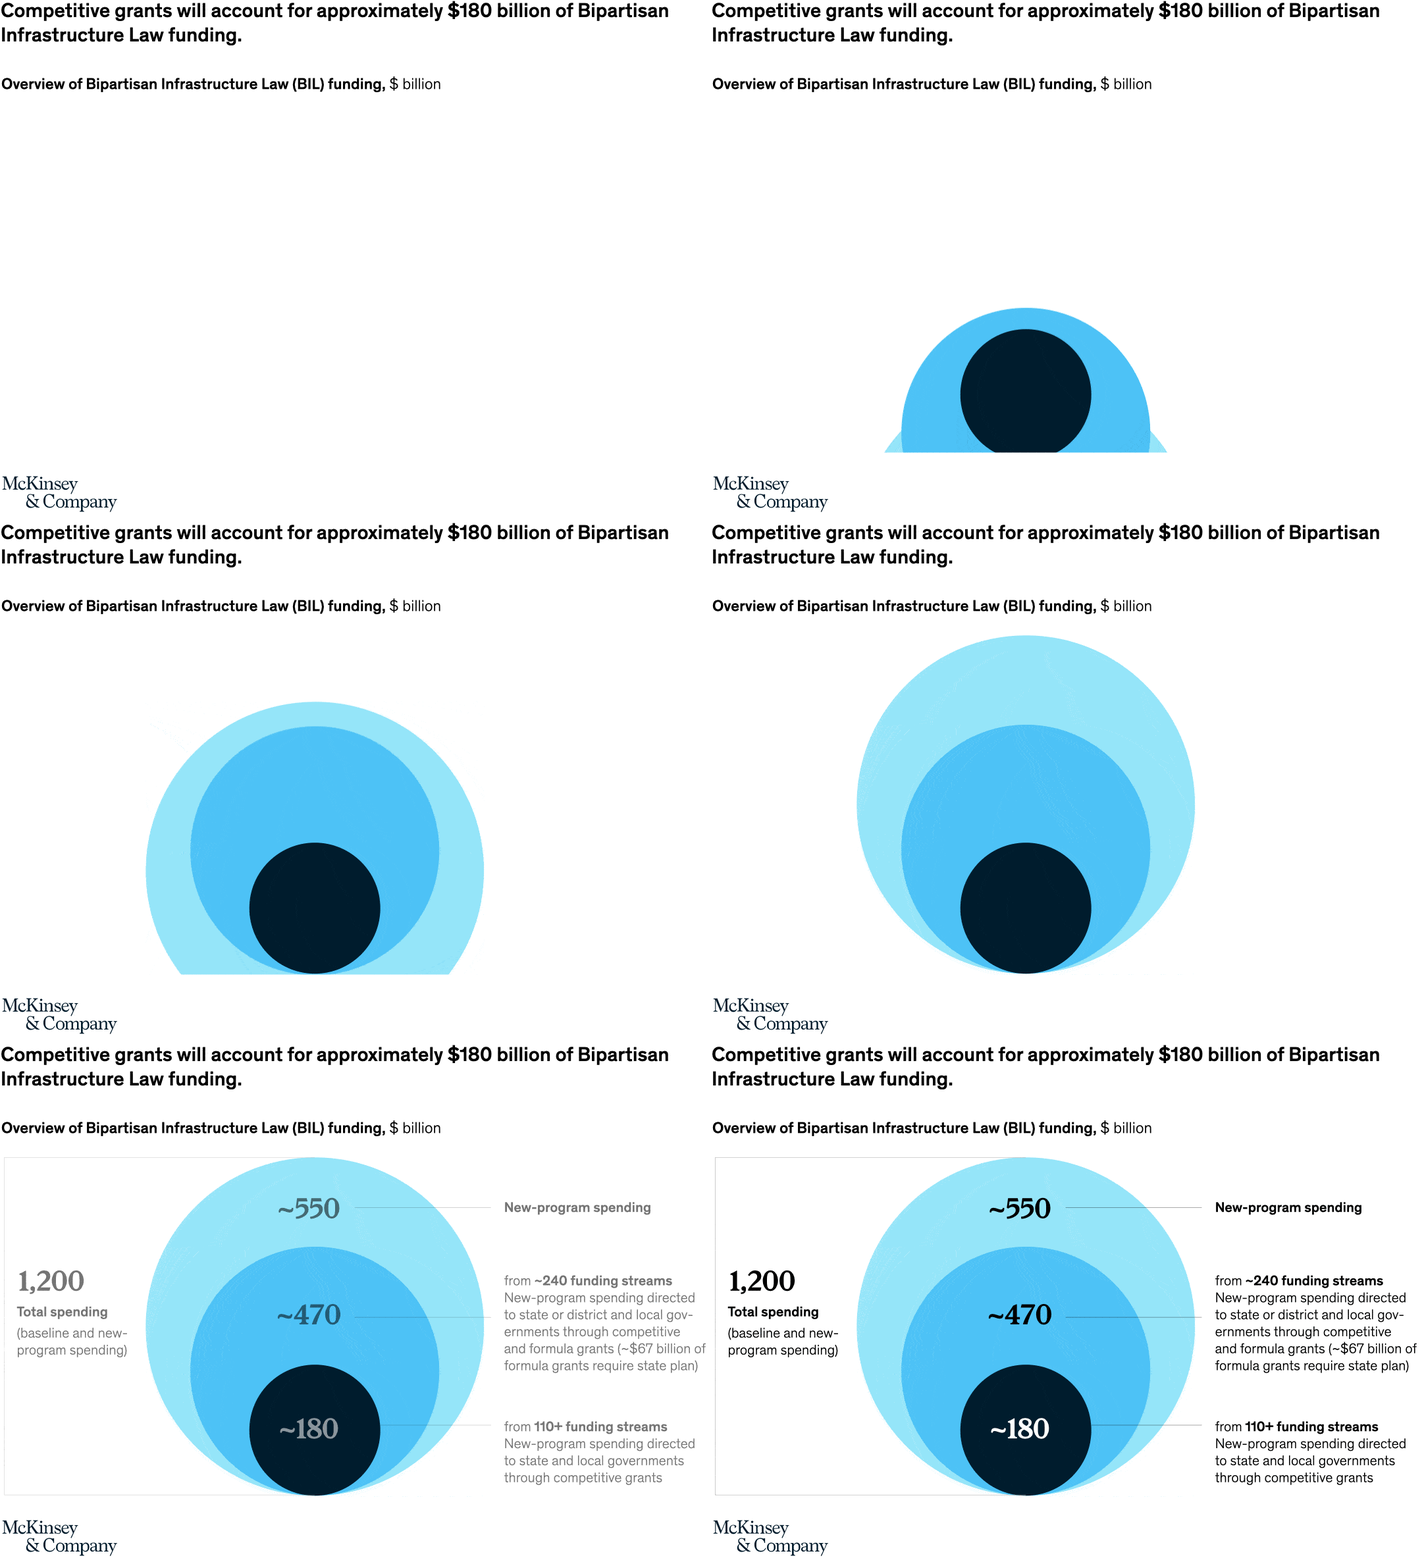
July 8, 2022 – The Bipartisan Infrastructure Law directs $470 billion in new spending toward state and local governments. Of that amount, $180 billion (approximately 38 percent) is dedicated to competitive grants—funds that are provided through a process in which the strength of application will likely be the determining factor for grant allocation.
To read the article, see “A new era of US infrastructure grants,” May 20, 2022.
customizer here
Visual form
Concentric-circle funding infographic.
Layout / body structure
The page uses three nested circles centered in one panel, with supporting labels to the right and a baseline total on the left. The eye moves from the smallest dark inner circle outward through the two larger blue circles, reading each as a subset of the larger infrastructure funding pool.
What is being compared
The infographic compares total Bipartisan Infrastructure Law funding with the portions that are new-program spending and, inside that, the part that will be distributed through competitive grants. It is showing the narrowing funnel from the broad funding pool down to the especially application-sensitive share.
Measurement system
The unit throughout is billions of dollars. Circle size is used to convey the relative magnitude of roughly $1,200 billion total spending, about $550 billion in baseline and new-program spending, around $470 billion in new-program spending, and roughly $180 billion in competitive grants.
Visible structure inside the graphic
The largest pale-blue outer circle represents the broadest funding bucket, the medium blue circle marks the narrower new-program slice, and the dark inner circle isolates the competitive-grant portion. Side annotations explain what each ring includes, so the structure combines area comparison with text labels instead of using bars or a stacked axis.
Main takeaway from the visual
The graphic shows that the competitive-grant pool is a substantial but still much smaller subset inside the larger infrastructure funding package. That is why application quality matters so much: a comparatively tight inner funding circle sits inside much broader headline spending totals.
Key standout values or extremes
The largest visible figure is 1,200 for total spending, followed by roughly 550 and roughly 470 for the intermediate funding buckets. The dark inner circle is labeled about 180, which is the competitive-grant amount and the key number the whole visualization is organized around.
Controls / sequence, when applicable
This is a static chart image with no in-chart controls to operate.
Companion media, when applicable
There is no separate companion audio or video; the chart image is the full visual on this page.