Source page: McKinsey & Company
Commentary
Marginalized groups bear the brunt of microaggressions
Diversity & Inclusion | Organization
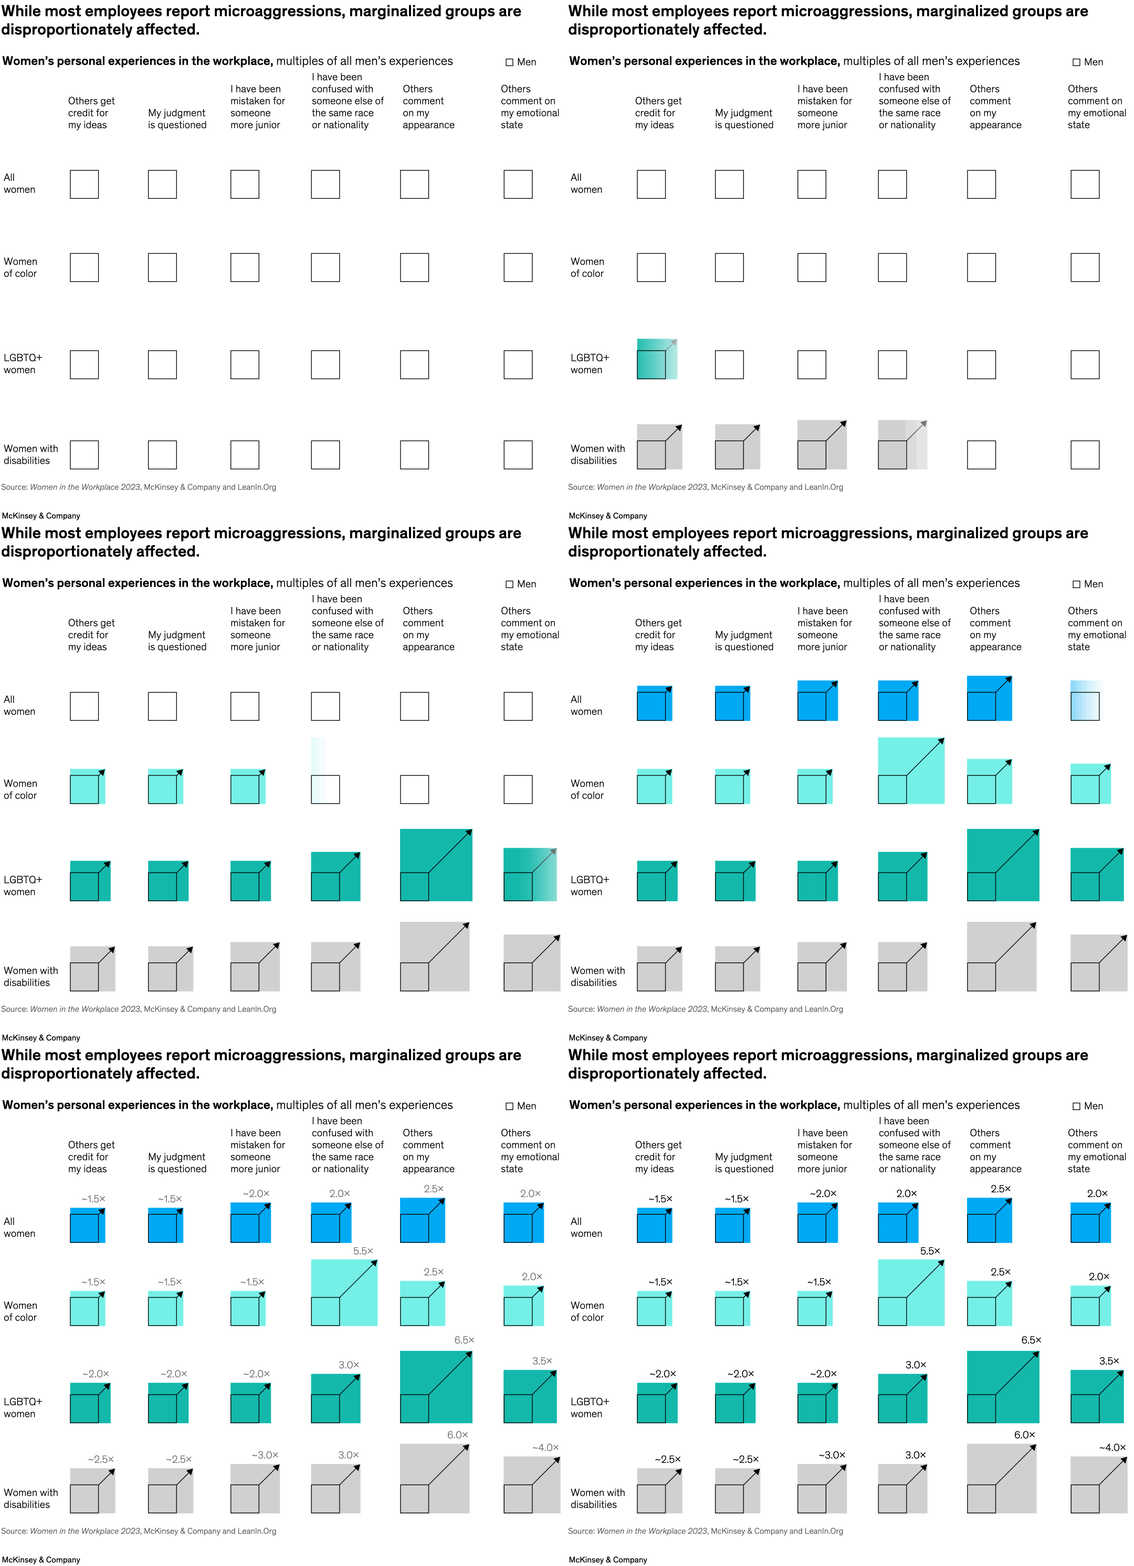
October 30, 2023 – Women experience microaggressions at significantly higher rates than men, research shows. And women with typically marginalized identities, such as women of color and women with disabilities, endure more frequent slights, according to senior partners Alexis Krivkovich and Lareina Yee in the latest Women in the Workplace report. For instance, Asian and Black women are seven times as likely as White women to be confused with someone of the same race and ethnicity.
To read the report, see “Women in the Workplace 2023,” October 5, 2023.
customizer here
Visual form
Matrix-style comparison chart rather than a single line or bar chart. It uses one column for each kind of workplace microaggression and one row for each employee group.
Layout / body structure
The chart reads left to right across the incident types and top to bottom through the groups, with a men reference at the top and the main rows for all women, women of color, LGBTQ+ women, and women with disabilities underneath.
What is being compared
It compares how often different groups report specific microaggressions such as others getting credit for ideas, judgment being questioned, being mistaken for someone more junior, being confused with someone of the same race or nationality, comments on appearance, and comments on emotional state.
Measurement system
The scale is expressed as multiples of men’s experiences, so the reader is tracking relative frequency rather than raw counts or percentages. The chart is about how much more often each group reports a slight compared with the male baseline.
Visible structure inside the graphic
The visual is organized as a grid of square markers placed at each row-and-column intersection. The category labels sit across the top, the group labels run down the left edge, and the matrix lets the viewer scan for which rows stay consistently higher across the columns.
Main takeaway from the visual
The heaviest burden sits on marginalized groups rather than on the overall average alone. The lower rows repeatedly carry the larger marks across several columns, showing that identity-based gaps stack up across multiple kinds of slights instead of appearing in only one category.
Key standout values or extremes
The most important standout is the repeated widening of the gap for women of color, LGBTQ+ women, and women with disabilities across the matrix. Even before reading the article text, the visual makes it clear that these rows sit above the broad all-women row on multiple measures.
Controls / sequence, when applicable
This is a static chart image with no in-chart controls to operate.
Companion media, when applicable
There is no separate companion audio or video; the chart image is the full visual on this page.