Source page: McKinsey & Company
Commentary
Mediterranean’s top crop faces climate-change risks
Climate change | Food
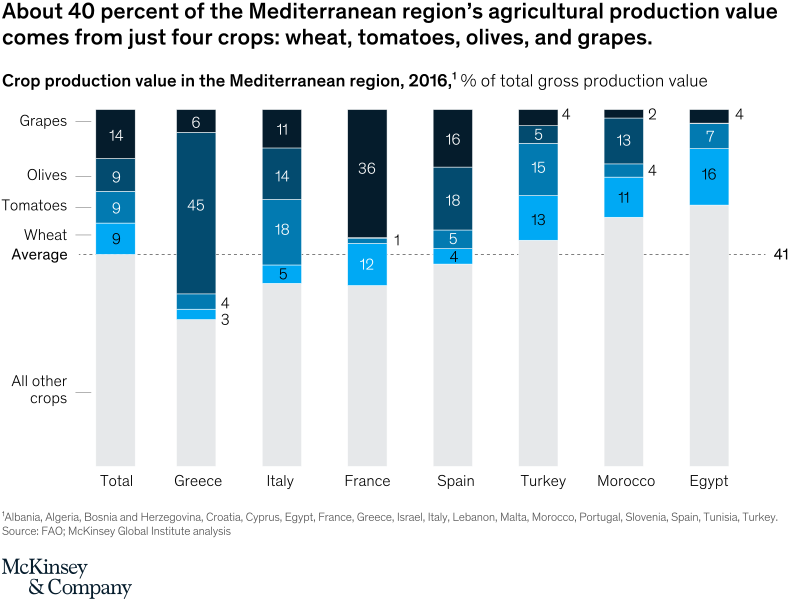
July 7, 2020 – A warming climate could drive the production of grapes, which account for 14 percent of the Mediterranean’s agricultural production value, further north by 2050. If that happens, it may take new winemaking regions generations to gain the right experience in growing grapes.
To read the article, see “A Mediterranean basin without a Mediterranean climate?,” May 28, 2020.
customizer here
Visual form
Stacked Bar / Stacked Column and Choropleth Map: Mediterranean crop-value mix with climate-risk geography.
Layout / body structure
Each country has a stacked vertical column that divides crop-production value into wheat, tomatoes, olives, grapes, and all other crops. Small maps and notes beside the bar chart identify the Mediterranean geographies where climate-change yield risks are expected.
What is being compared
It compares the crop-production value mix across Mediterranean countries and links that concentration to climate exposure for the region’s major crops.
Measurement system
The stacked bars show percent of total gross crop production value in 2016. The reference line marks the regional average share across the four highlighted crops.
Visible structure inside the graphic
The highlighted crops take up large portions of the columns in several countries, but the mix differs by country. Greece is heavily tomato-weighted, France has a prominent olive segment, and Spain and Turkey show more mixed crop profiles.
Main takeaway from the visual
The chart shows that climate risk matters economically because a large share of Mediterranean agricultural value is concentrated in a small set of crops. Risks to grapes, wheat, tomatoes, and olives can therefore affect a significant part of regional production value.
Key standout values or extremes
The total bar shows the four highlighted crops adding to roughly 41 percent of regional crop-production value. Grapes alone account for 14 percent of the Mediterranean’s agricultural production value.
Controls / sequence, when applicable
This is a static stacked-column chart with map context; there are no in-chart controls to operate.
Companion media, when applicable
There is no separate companion audio or video; the stacked crop-value chart and maps are the full visual on this page.