Source page: McKinsey & Company
Commentary
Mitigating climate change
Climate change
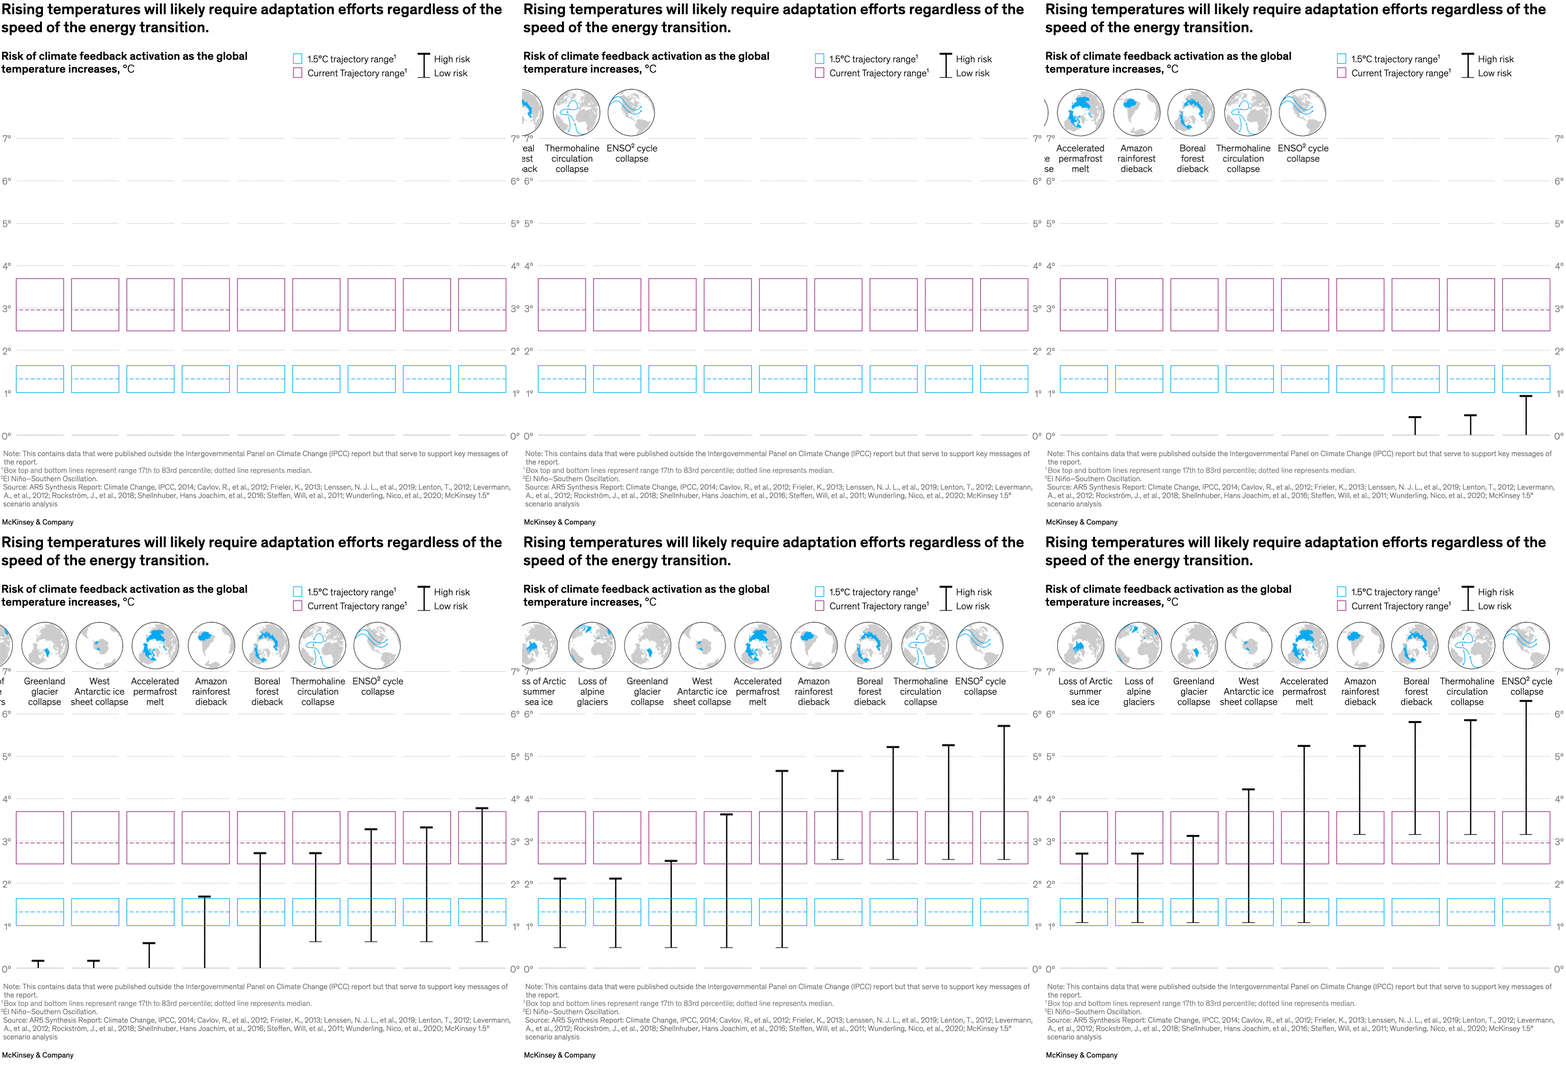
February 29, 2024 – While global CO2 emissions may decline after 2025, average warming is likely to exceed the 1.5°C threshold by 2035. As a result, unpredictable weather patterns could become more frequent and intense, senior partner Christer Tryggestad and colleagues note. This could activate climate feedback loops such as the collapse of the Greenland glacier. The onus may be on countries to encourage mitigation practices, which could help create jobs and economic value for communities while mitigating the risks of climate change.
To read the article, see “Global Energy Perspective 2023: CO2 emissions outlook,” January 24, 2024.
customizer here
Visual form
Threshold chart with annotated climate-risk ranges and map callouts.
Layout / body structure
The chart places a row of nine climate feedback mechanisms across the top and aligns each one with a vertical risk range below, so the reader moves left to right from one tipping element to the next.
What is being compared
It compares when different climate feedback mechanisms could activate as global temperature increases and sets those risk ranges against a 1.5C trajectory band and a current-trajectory band.
Measurement system
The vertical axis is temperature increase in degrees Celsius, the colored boxes show the two warming trajectory ranges, and the black error bars mark lower-risk to high-risk activation ranges with a dotted median.
Visible structure inside the graphic
Each column pairs a small locator map and label with one vertical range marker underneath, letting the reader compare Arctic sea ice, glaciers, ice sheets, forests, circulation systems, and the ENSO cycle in the same frame.
Main takeaway from the visual
Several feedback risks overlap with the temperature zone the world is approaching, so the visual argues that adaptation pressure remains even if the transition speeds up.
Key standout values or extremes
The 1.5C trajectory band sits around the low-1-degree range, the current trajectory band sits around the 3-degree range, and higher-risk ranges for later feedbacks such as boreal forest dieback, thermohaline circulation collapse, and ENSO cycle collapse extend well above 5 degrees.
Controls / sequence, when applicable
This is a static chart image with no in-chart controls to operate.
Companion media, when applicable
There is no separate companion audio or video; the chart image is the full visual on this page.