Source page: McKinsey & Company
Commentary
More narrow-body aircraft take flight
Productivity | Aerospace | Manufacturing
September 27, 2024 – This week, our charts feature the latest insights in aviation—from soaring fleet demands to landing the right talent and more.
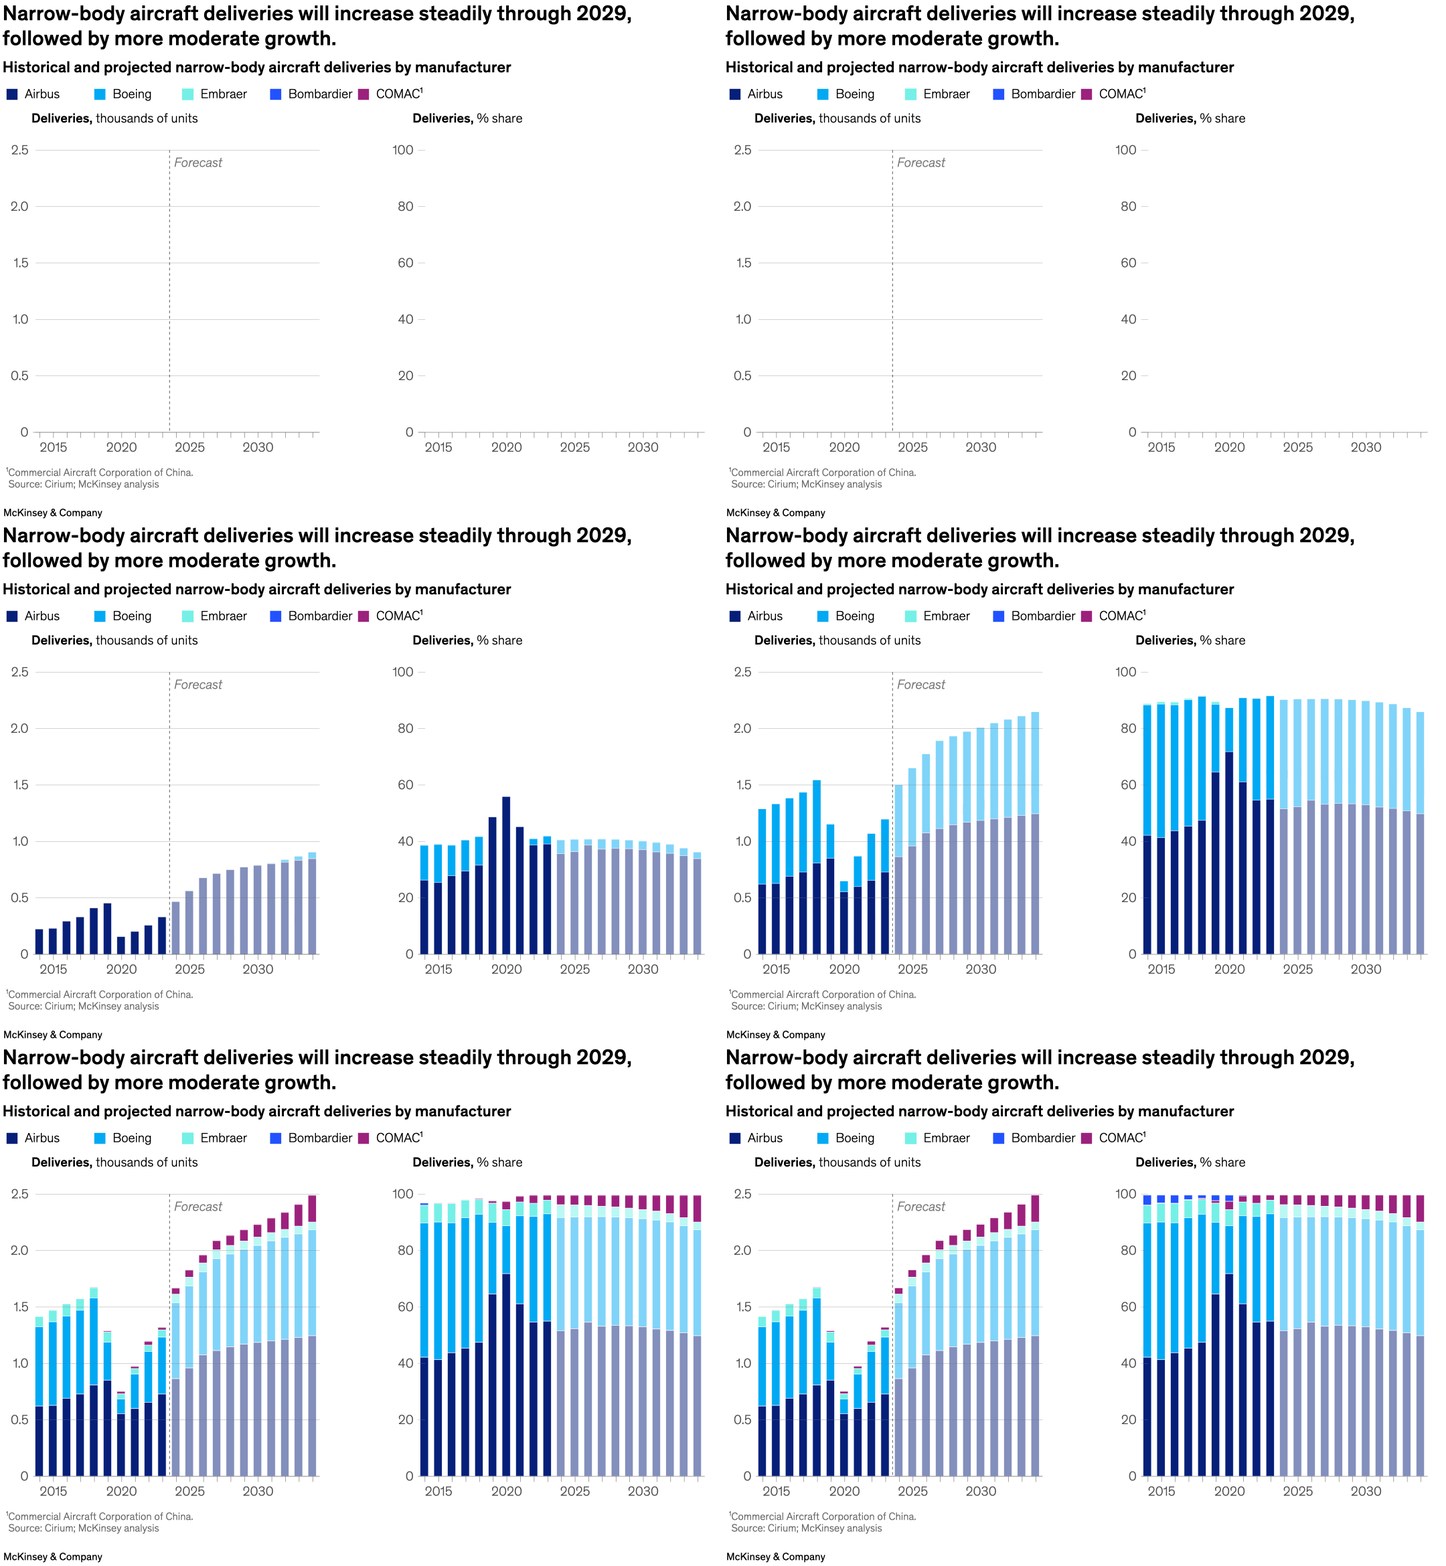
Narrow-body aircraft deliveries fell sharply in 2019 and 2020, but they have increased since then and are expected to rise steadily through 2029. Narrow-body deliveries should grow more moderately after that, partner Andreas Behrendt and colleagues explain.
To read the article, see “Improving productivity in low-volume, high-complexity manufacturing,” July 18, 2024.
customizer here
Visual form
Two-panel stacked bar chart sequence.
Layout / body structure
The chart is split into two synchronized panels. The left panel shows stacked annual deliveries in units with a dashed line marking the shift into forecast years, and the right panel shows the same delivery story as percentage share by manufacturer, so the page is read left to right from total volume to market mix.
What is being compared
It compares historical and projected narrow-body aircraft deliveries by manufacturer, looking both at the total number of aircraft delivered each year and at how the manufacturer shares of those deliveries evolve over time.
Measurement system
The left panel uses thousands of units, while the right panel uses percent share out of 100. Color distinguishes Airbus, Boeing, Embraer, Bombardier, and COMAC, and the identical yearly cadence across the two panels keeps the unit and share views aligned.
Visible structure inside the graphic
Each year is a stacked column in both panels, with the total-height panel on the left and the normalized share panel on the right. The dashed forecast divider, the steadily taller columns after 2024, and the growing magenta COMAC slices in the forecast years are the key organizing visual cues.
Main takeaway from the visual
The chart shows narrow-body deliveries climbing steadily through the rest of the decade and then growing more gradually after that, while Airbus and Boeing remain the dominant manufacturers throughout. The share panel also shows COMAC gaining visibility in the future mix without displacing the two leading incumbents from the largest portions of the stack.
Key standout values or extremes
Total projected deliveries rise to roughly 2.5 thousand units by the end of the forecast horizon, up from the dip around 2020 and above the pre-pandemic highs. In the share panel, Airbus sits around half of projected deliveries, Boeing remains the next-largest slice, and COMAC grows toward a low-double-digit share by the final years.
Controls / sequence, when applicable
This is a static chart image with no in-chart controls to operate.
Companion media, when applicable
There is no separate companion audio or video; the chart image is the full visual on this page.