Source page: McKinsey & Company
Commentary
More wafers, please
Semiconductors | Supply Chain Management | Technology
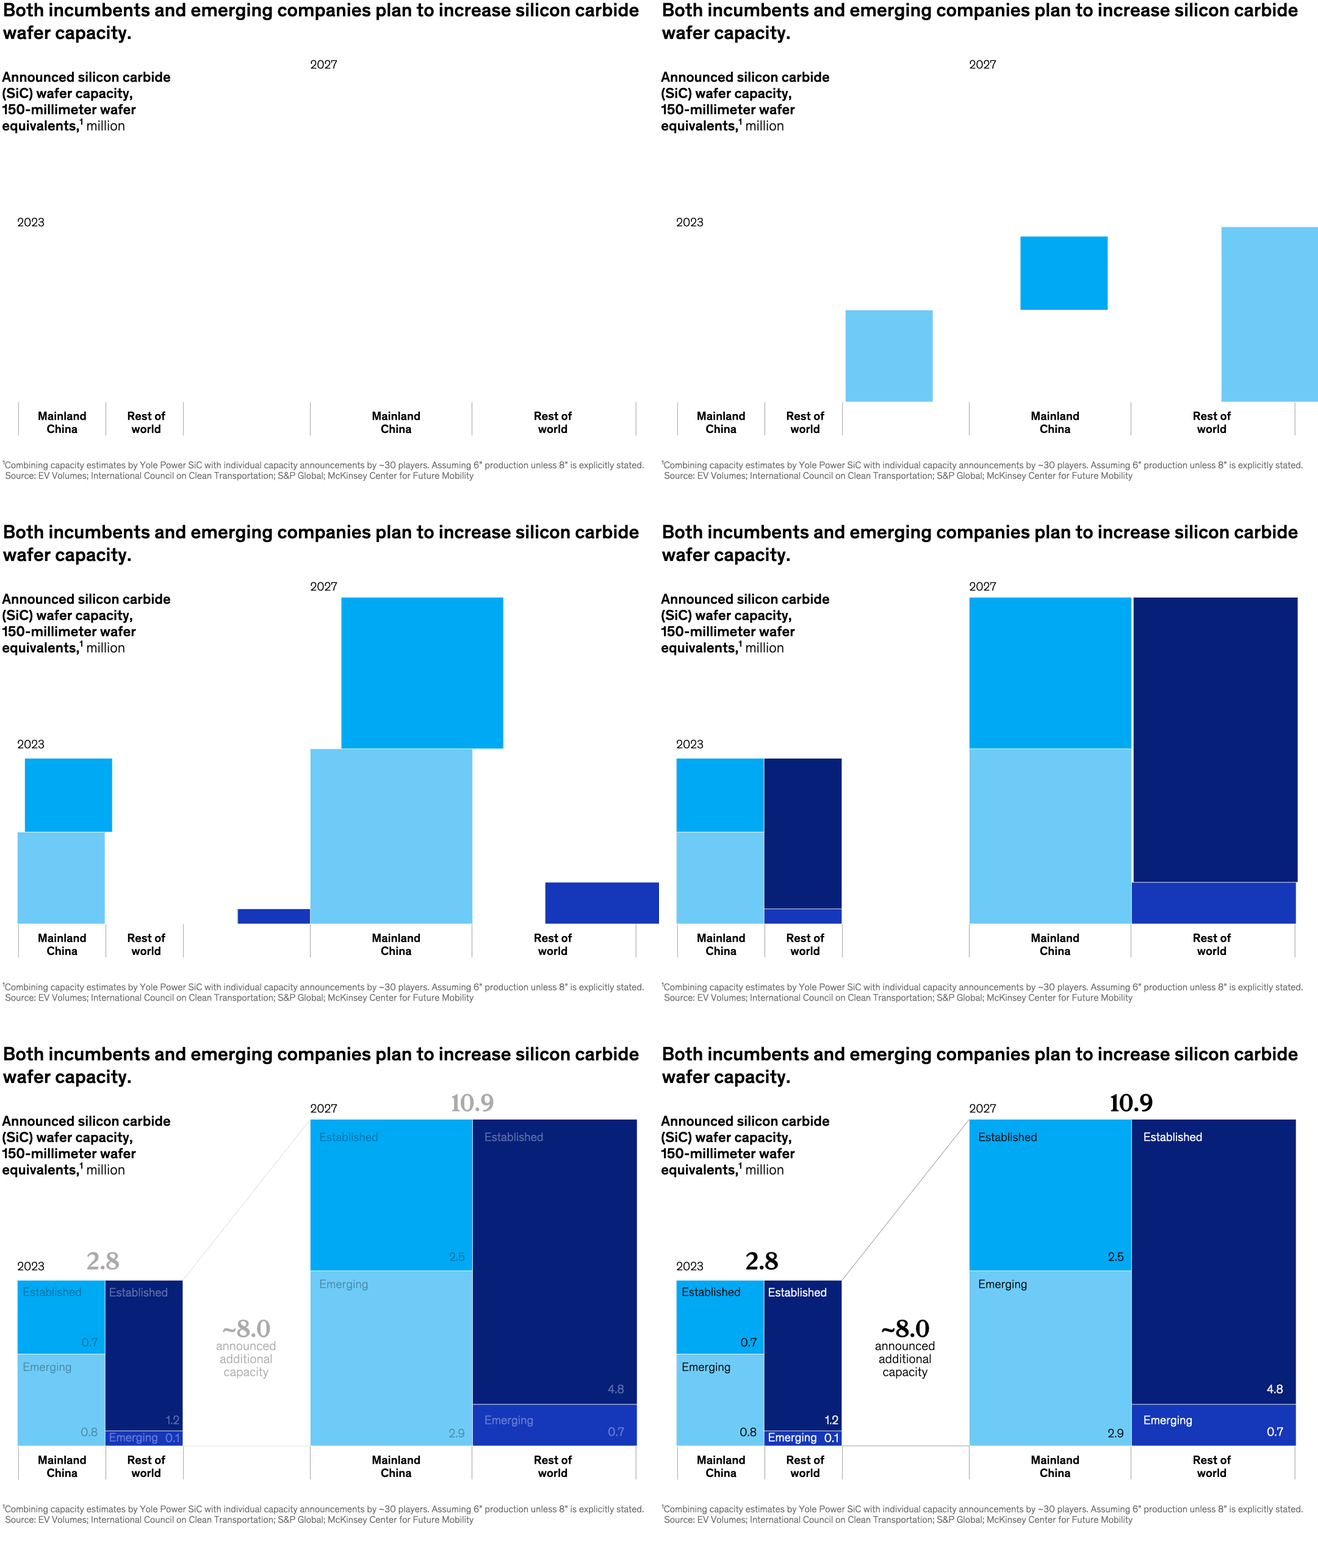
October 3, 2024 – Excitement over battery electric vehicles has led silicon carbide wafer makers to plan a more than threefold increase in capacity—surpassing ten million 150-millimeter wafer equivalents by 2027. Senior partner Bill Wiseman and colleagues note that while established players currently dominate the market, emerging companies are a large proportion of the announced growth. But these emerging companies may have difficulty meeting their projections because of their lack of experience in the market, which may reduce their product yield.
To read the article, see “Managing uncertainty in the silicon carbide wafer market,” August 6, 2024.
customizer here
Visual form
Marimekko-style stacked block chart.
Layout / body structure
The chart uses two large composite blocks placed side by side for 2023 and 2027, with each year split into Mainland China and Rest of world and then further divided into established and emerging capacity. The page is read left to right across time and within each year from geography into company maturity.
What is being compared
It compares announced silicon carbide wafer capacity across two years, two geographies, and two producer groups, showing how both incumbents and emerging companies contribute to the expansion.
Measurement system
The chart measures millions of 150-millimeter wafer equivalents. Totals for each year are printed above the large blocks, while the interior numbers label the capacity pieces for established and emerging players within Mainland China and the rest of the world.
Visible structure inside the graphic
The 2023 block is much smaller and the 2027 block is much larger, visually reinforcing the scale-up. Within each year, the rectangles are subdivided both vertically and horizontally so the viewer can see the size of mainland versus rest-of-world capacity and the split between established and emerging suppliers.
Main takeaway from the visual
The chart shows a step change in announced wafer capacity by 2027 rather than incremental growth. Capacity expands on both sides of the geography split, and both established players and emerging companies add material volume, which is why the 2027 block becomes almost four times the size of the 2023 block.
Key standout values or extremes
The total rises from 2.8 in 2023 to 10.9 in 2027, with an annotation calling out roughly 8.0 of additional announced capacity. In 2027, Mainland China contributes 2.5 of established and 2.9 of emerging capacity, while the rest of the world contributes 4.8 established and 0.7 emerging.
Controls / sequence, when applicable
This is a static chart image with no in-chart controls to operate.
Companion media, when applicable
There is no separate companion audio or video; the chart image is the full visual on this page.