Source page: McKinsey & Company
Commentary
Most diverse companies now more likely than ever to outperform financially
COVID-19 | Diversity & Inclusion | Economics
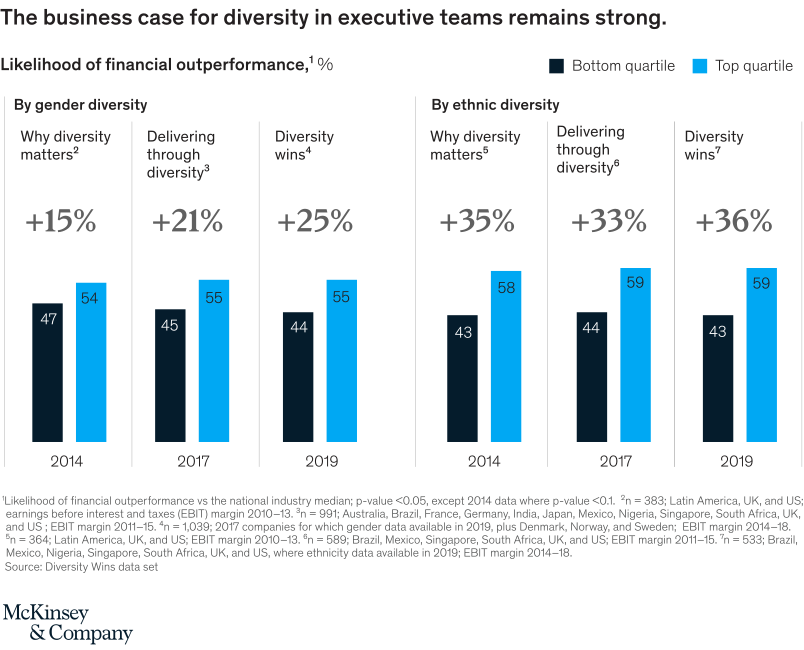
June 19, 2020 – The latest report from our years-long research into ethnic and gender diversity shows an increasing correlation between being in the top quartile for diversity and financial outperformance.
To read the report, see “Diversity wins: How inclusion matters,” May 19, 2020.
customizer here
Visual form
Bar Chart: paired quartile comparisons for diversity and financial outperformance.
Layout / body structure
The chart is split into two halves: gender diversity on the left and ethnic diversity on the right. Within each half, paired vertical bars compare bottom-quartile and top-quartile companies across three report waves, with the outperformance advantage printed above each pair.
What is being compared
It compares the likelihood of financial outperformance for companies in the bottom and top quartiles of executive-team diversity. The comparison is made separately for gender diversity and ethnic diversity.
Measurement system
The bars are measured as percent likelihood of financial outperformance. The callouts above the bar pairs show the top-quartile advantage over the bottom quartile as a percentage difference.
Visible structure inside the graphic
The blue top-quartile bars are higher than the dark bottom-quartile bars in every pair. The ethnic-diversity half shows especially large gaps, with top-quartile bars near 58 to 59 percent and bottom-quartile bars near 43 to 44 percent.
Main takeaway from the visual
The chart shows that the business case for executive-team diversity strengthened across the research waves. Companies in the top diversity quartile were consistently more likely to outperform financially, especially on ethnic diversity.
Key standout values or extremes
For gender diversity, the advantage rises from 15 percent to 25 percent across the displayed waves. For ethnic diversity, the gap is larger, reaching 35 percent to 36 percent in two of the three comparisons.
Controls / sequence, when applicable
This is a static paired bar chart; there are no in-chart controls to operate.
Companion media, when applicable
There is no separate companion audio or video; the paired bar chart is the full visual on this page.