Source page: McKinsey & Company
Commentary
Myth busting in marketing
Marketing & Sales | Retail
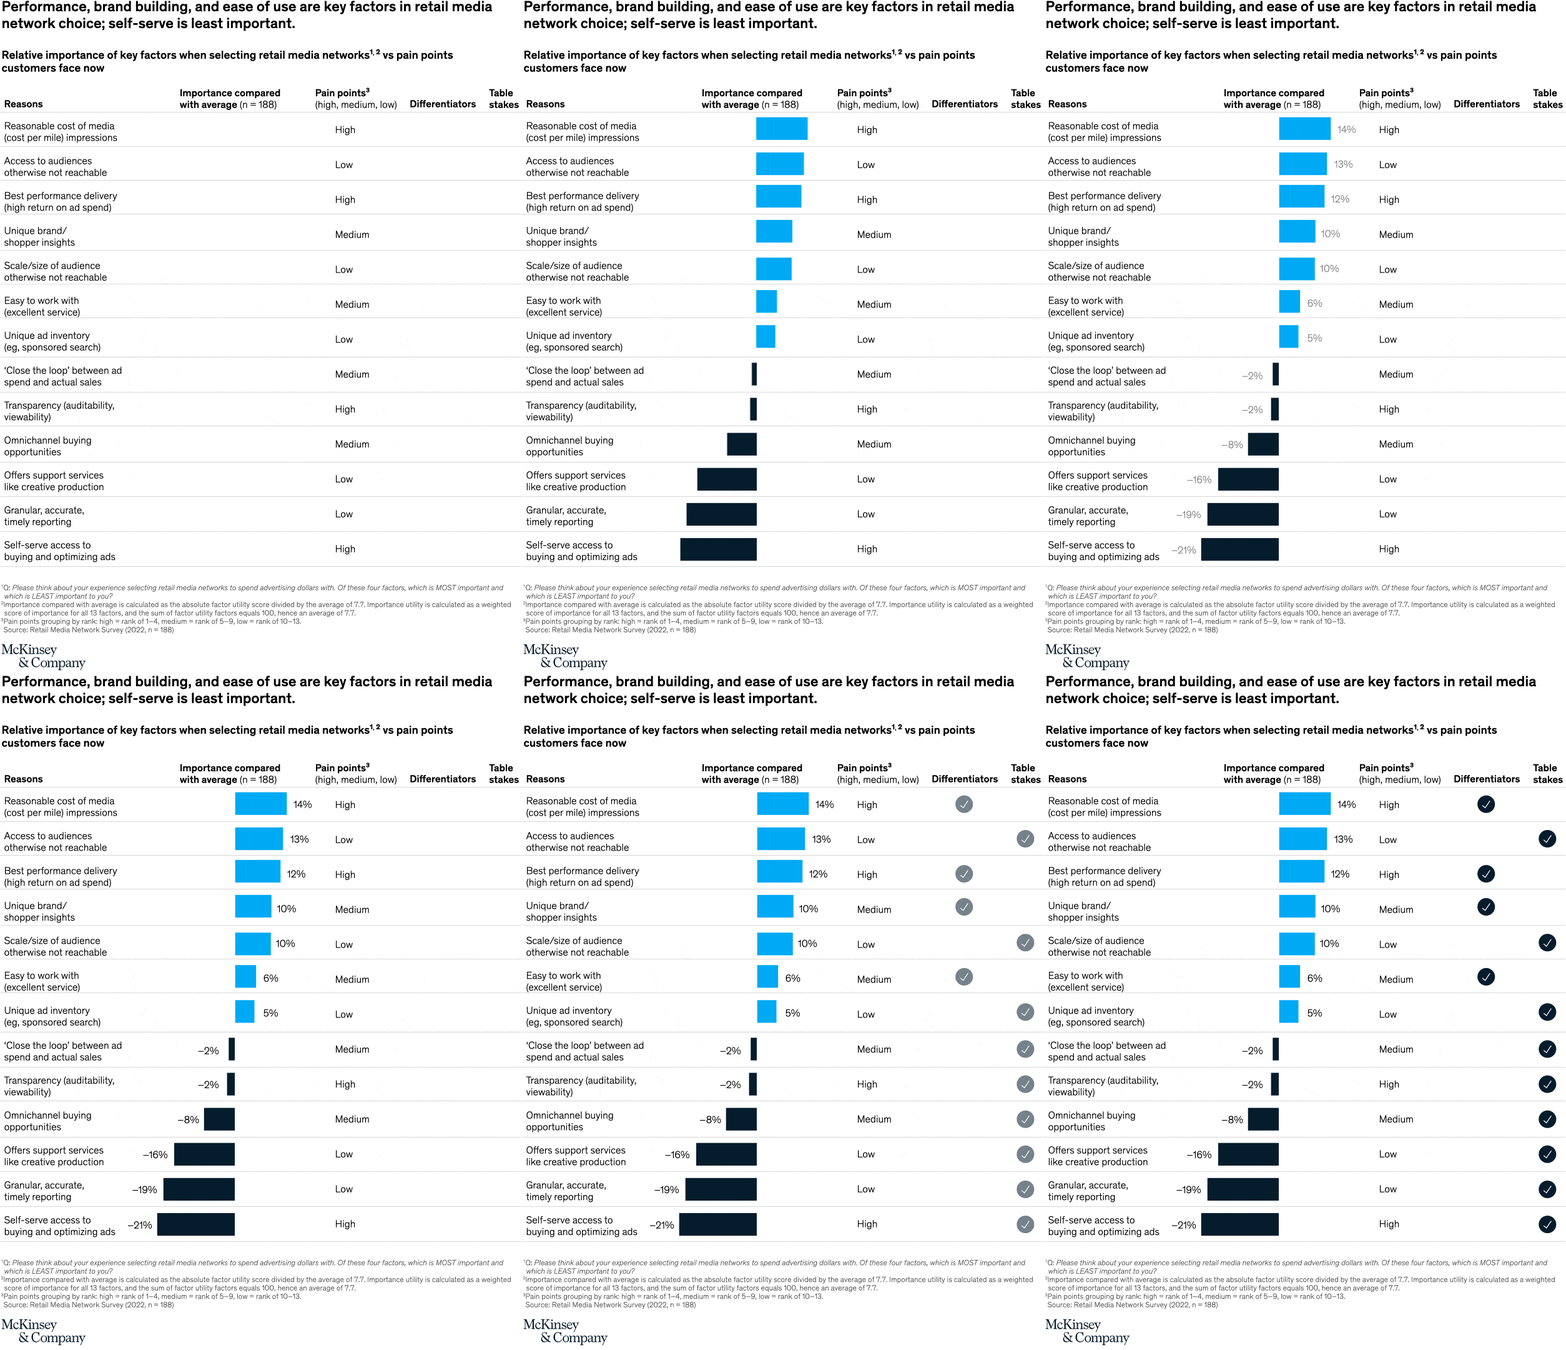
August 18, 2022 – Marketing budgets are flowing toward retail media networks (RMNs), which are platforms where retailers offer advertisers unique audiences and valuable data insights. One myth of RMNs, according to our latest Retail Media Networks Advertiser Survey: self-serve access creates a competitive advantage. Surveyed advertisers said other factors mattered more, including performance, access to unique audiences, and ease of working with the RMN.
To read the article, see “Busted! Five myths about retail media,” June 7, 2022.
customizer here
Visual form
A ranked table chart with diverging horizontal bars and category markers.
Layout / body structure
The chart is laid out like a table. The left column lists the reasons advertisers choose retail media networks, the middle column shows a positive-or-negative importance score versus average with diverging bars, the next column labels current pain points as high, medium, or low, and the two rightmost columns mark whether each item is a differentiator or a table stake.
What is being compared
The chart compares thirteen advertiser decision factors for retail media networks, measuring how much more or less important each one is relative to the average factor while also showing where customers experience pain points and whether the factor acts as a differentiator or basic table stake.
Measurement system
The main numeric scale is importance compared with average, expressed as a positive or negative percentage around zero. Blue bars to the right indicate above-average importance, dark bars to the left indicate below-average importance, the pain-point column uses high, medium, and low labels, and icon checks sort each row into differentiators or table stakes.
Visible structure inside the graphic
The top of the table is dominated by right-extending blue bars for reasonable cost of media at 14 percent, access to otherwise unreachable audiences at 13 percent, best performance delivery at 12 percent, and unique brand or shopper insights and scale or size of audience at 10 percent each. Near the bottom, dark left-extending bars mark the least important factors, culminating in self-serve access to buying and optimizing ads at minus 21 percent. The right-hand icon columns make it easy to see that some factors are true differentiators while others are merely expected capabilities.
Main takeaway from the visual
The visual shows that advertisers choose retail media networks for commercial performance and audience value, not for self-serve tooling. Cost, audience access, performance delivery, and insights sit at the top of the ranking, while self-serve access lands at the very bottom, which directly punctures the myth that self-serve is the key competitive edge.
Key standout values or extremes
The strongest positive values are reasonable cost of media at 14 percent, access to audiences otherwise not reachable at 13 percent, and best performance delivery at 12 percent. The weakest items are offers support services like creative production at minus 16 percent, granular and timely reporting at minus 19 percent, and self-serve access to buying and optimizing ads at minus 21 percent, which is the lowest value on the chart.
Controls / sequence, when applicable
This is a static chart image with no in-chart controls to operate.
Companion media, when applicable
There is no separate companion audio or video; the chart image is the full visual on this page.