Source page: McKinsey & Company
Commentary
Nationwide housing crisis
Economic Development | Public Sector
October 1, 2025 – Quality affordable housing is essential for economic mobility but remains unattainable for too many in the United States. A severe housing shortage that spans the entire country is fueling the crisis, say Senior Partner Shelley Stewart III and coauthors. The housing shortage nearly doubled between 2012 and 2023, climbing to 8.2 million units. By 2035, the shortage could reach 9.6 million units, further entrenching financial insecurity across the nation. Closing the gap may require $2.7 trillion through 2035 but could potentially boost GDP by $1.9 trillion and create 1.7 million jobs.
To explore the interactive, see “Mapping the US affordable housing crisis and unlocking opportunities for economic mobility,” August 11, 2025.
customizer here
Visual form
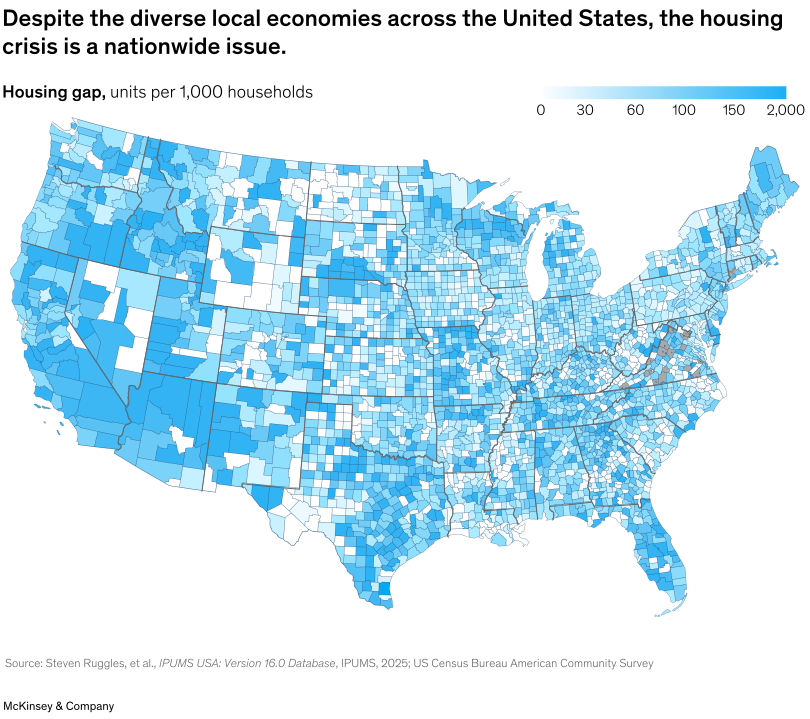
County-level choropleth map of the United States.
Layout / body structure
The chart is a single full-width US map that reads spatially rather than left to right, with a color scale legend placed in the upper-right corner. The counties are shaded directly on the map, so the reader scans across regions to compare the distribution of housing gaps.
What is being compared
It compares the housing gap across US counties, measured as housing units per 1,000 households, to show where shortages are lighter or more severe.
Measurement system
The map uses a blue choropleth scale running from 0 to 2,000 units per 1,000 households. Darker, more saturated blue indicates a larger housing gap, while very light or white counties indicate much smaller gaps.
Visible structure inside the graphic
The visual is built from thousands of county polygons shaded along the same gradient. Western states, parts of the Northeast, and scattered counties across the South and Midwest show stronger blues, while lighter counties appear throughout the country rather than being concentrated in only one region.
Main takeaway from the visual
The shortage is geographically widespread, with visible stress in many parts of the country, which supports the headline claim that the housing crisis is national rather than confined to a few local markets.
Key standout values or extremes
The legend shows the scale stretching from 0 through 30, 60, 100, 150, and up to 2,000 units per 1,000 households. The darkest concentrations appear in multiple regions of the West and Northeast, but the map also shows many moderate-gap counties distributed across the South, Midwest, and interior states.
Controls / sequence, when applicable
This is a static chart image with no in-chart controls to operate.
Companion media, when applicable
There is no separate companion audio or video; the chart image is the full visual on this page.