Source page: McKinsey & Company
Commentary
Net-zero obstacles ahead
Climate change | Decarbonization
August 11, 2022 – The remaining carbon budget available to keep global warming below 1.5°C is nearly gone, and some of the interdependencies required for staying on the path to net zero make its achievement tenuous. Delays in establishing new electricity transmission lines, for example, could hinder a rollout of the solar and wind power that other decarbonization projects need.
To read the article, see “Failure is not an option: Increasing the chance of achieving net zero,” June 2, 2022.
customizer here
Visual form
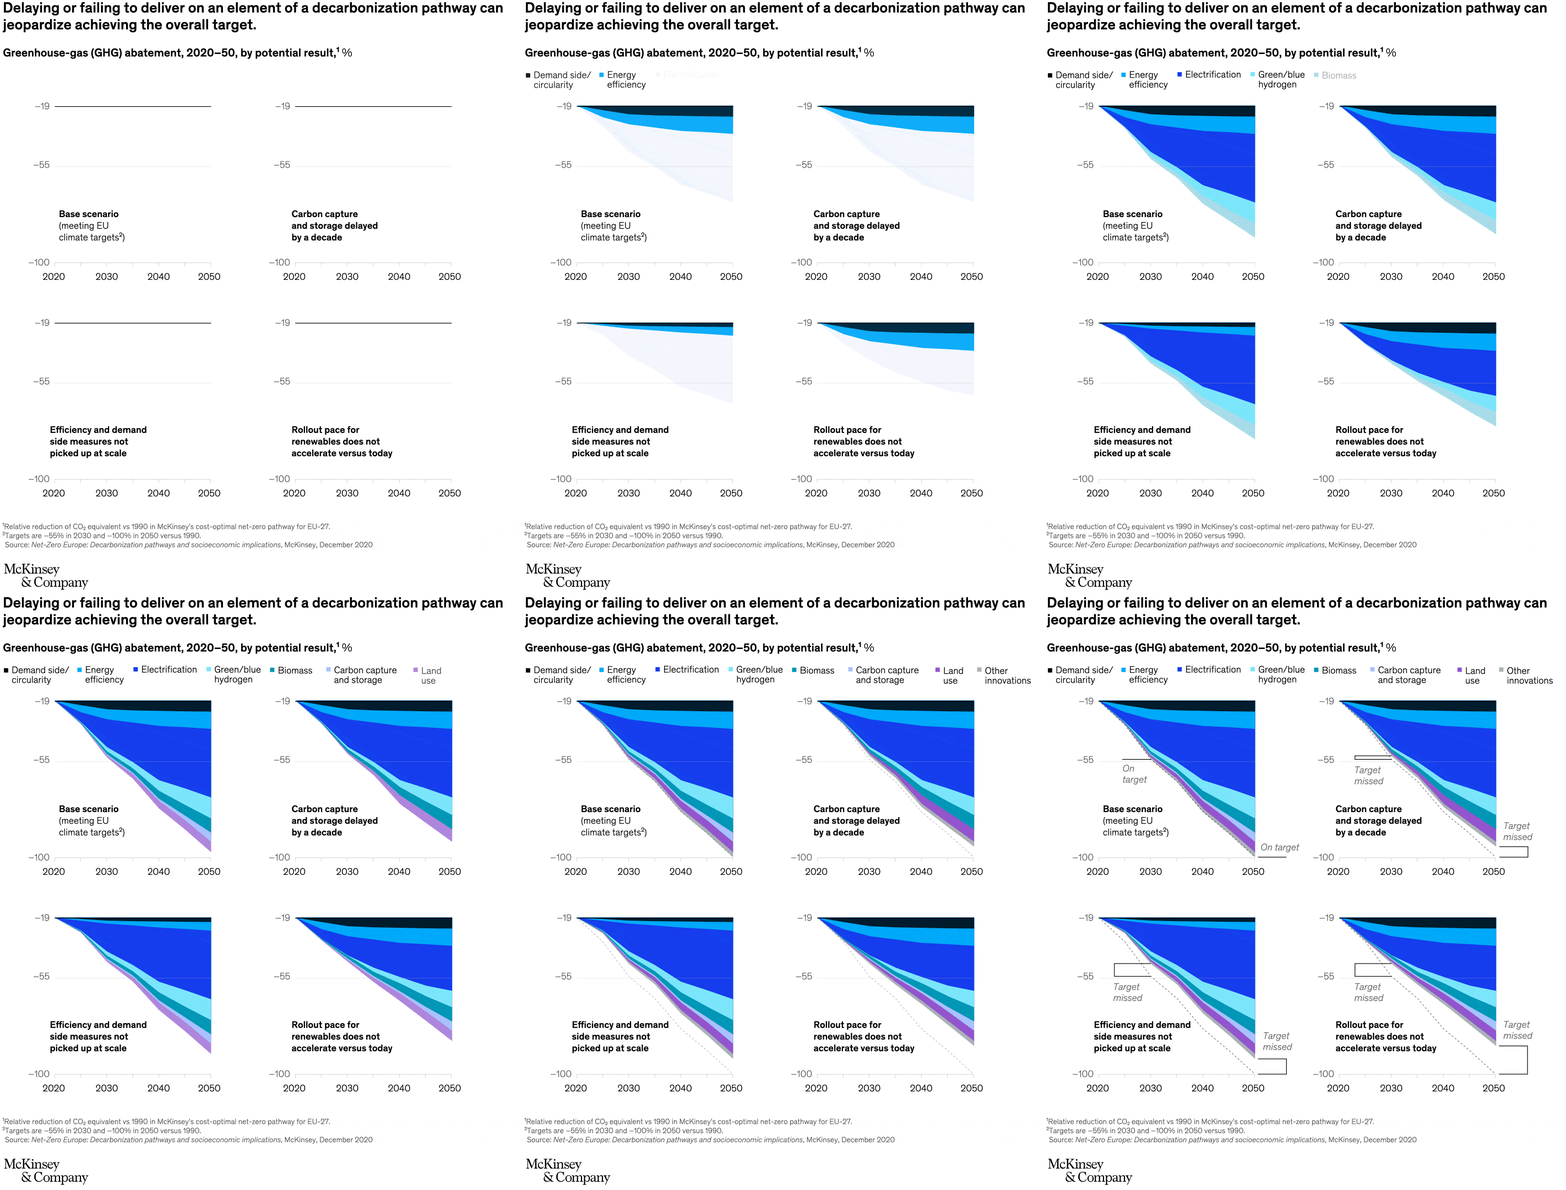
Four-panel stacked area scenario chart.
Layout / body structure
The chart is arranged as a two-by-two grid of small multiples. The top-left panel is the Base scenario, and the other three panels show alternative failure cases, so the reader moves panel by panel while keeping the same axes, legend, and time horizon in view.
What is being compared
The chart compares four decarbonization pathways for greenhouse-gas abatement from 2020 to 2050: the base case for meeting EU climate targets, a pathway where carbon capture and storage is delayed by a decade, a pathway where efficiency and demand-side measures are not picked up at scale, and a pathway where renewable rollout does not accelerate versus today.
Measurement system
The horizontal axis runs from 2020 to 2050, and the vertical scale tracks greenhouse-gas abatement potential result in percent, with anchors at -19, -55, and -100. The colored layers represent named abatement levers, including demand-side circularity, energy efficiency, electrification, green-blue hydrogen, biomass, carbon capture and storage, land use, and other innovations.
Visible structure inside the graphic
Each panel is a stacked wedge of colored bands that widens over time as more abatement is accumulated. The same layer order is repeated in all four panels, which makes it possible to see exactly where the failure scenarios flatten or narrow compared with the base path, especially in the lower half of the stack by 2040 and 2050.
Main takeaway from the visual
The chart shows that net zero depends on multiple abatement wedges arriving together. When any one of the named pathways slips, the total stack no longer deepens enough by 2050, so the failure scenarios visibly fall short of the full base-scenario descent toward the bottom of the scale.
Key standout values or extremes
The strongest shared anchors are the common starting point around -19 in 2020 and the target line of -100 by 2050. The base scenario reaches the deepest cumulative abatement by the end of the horizon, while the delayed carbon capture scenario and the slowed renewables scenario finish noticeably higher, leaving a visible shortfall versus the base case.
Controls / sequence, when applicable
This is a static chart image with no in-chart controls to operate.
Companion media, when applicable
There is no separate companion audio or video; the chart image is the full visual on this page.