Source page: McKinsey & Company
Commentary
New York state of mind
Public Sector | Diversity & Inclusion
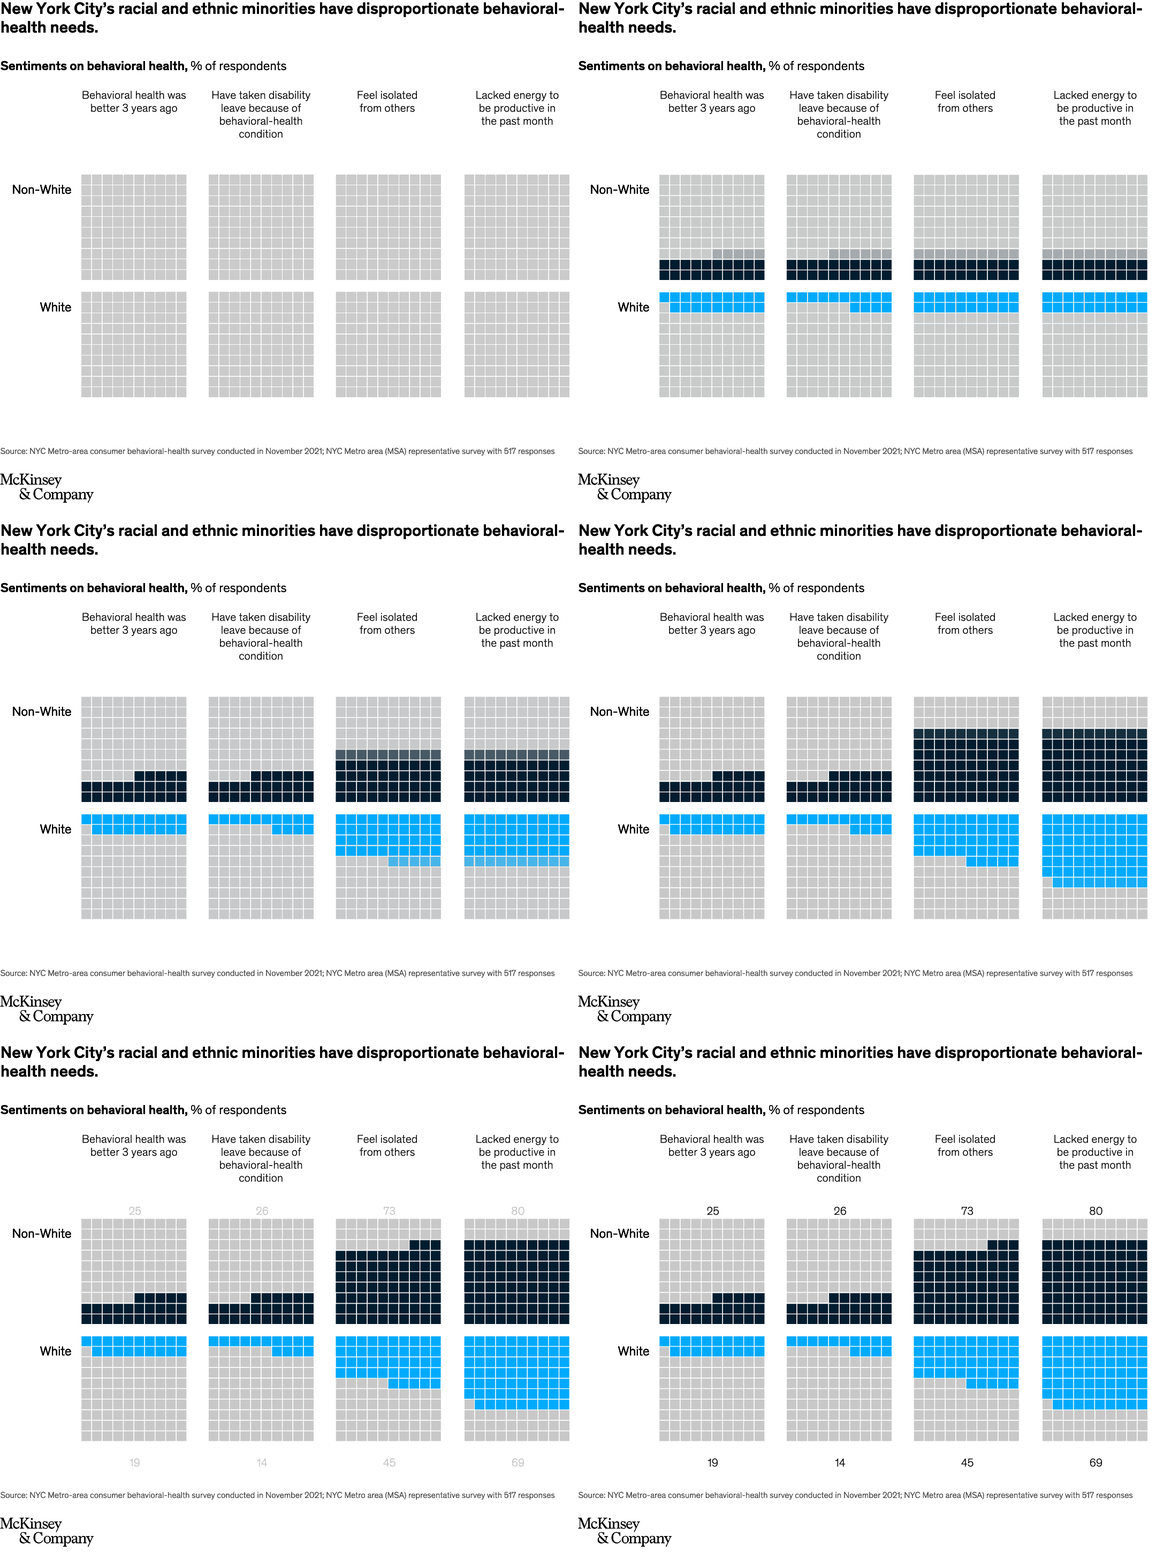
March 9, 2022 – Compared with White residents, New York City’s racial and ethnic minorities have higher behavioral health needs. These populations, according to McKinsey research, are more likely to experience isolation, lack the energy to be productive, or take disability leave because of a behavioral-health condition. Our article explores how to improve access to quality care.
To read the article, see “Addressing the state of behavioral health in New York City,” February 16, 2022.
customizer here
Visual form
Two-row four-column group comparison chart.
Layout / body structure
The chart is arranged as four vertical sentiment columns, with the non-White row placed above the White row. Reader moves left to right across the four behavioral-health measures and compares the top-row percentage with the lower-row percentage in each column.
What is being compared
The chart compares White and non-White respondents in New York City on four behavioral-health measures: whether behavioral health was better three years ago, whether they have taken disability leave because of a behavioral-health condition, whether they feel isolated from others, and whether they lacked energy to be productive in the past month.
Measurement system
Each figure is a percent of respondents reporting the sentiment named at the top of the column. The percentages are printed directly in each row, so the reader tracks the racial-group gap measure by measure rather than following an axis-based plot.
Visible structure inside the graphic
Each column has a short heading and then two stacked numeric rows, with non-White percentages grouped together in the upper band and White percentages grouped in the lower band. The repeated column structure makes the higher top-row values stand out immediately, especially in the two rightmost measures where the spread is largest.
Main takeaway from the visual
Non-White respondents report worse behavioral-health-related outcomes across the board, with higher percentages in every visible comparison. The chart reads as a consistent disparity pattern rather than a single isolated gap, because the top row stays above the bottom row in all four columns.
Key standout values or extremes
The non-White row shows 25 percent saying behavioral health was better three years ago, 26 percent saying they have taken disability leave, 73 percent feeling isolated from others, and 80 percent lacking energy to be productive. The White row is lower in every visible counterpart, including 19 percent, 14 percent, and 45 percent in the first three comparable measures.
Controls / sequence, when applicable
This is a static chart image with no in-chart controls to operate.
Companion media, when applicable
There is no separate companion audio or video; the chart image is the full visual on this page.