Source page: McKinsey & Company
Commentary
Not inclusive? You're losing 39 percent of job applicants
Diversity & Inclusion
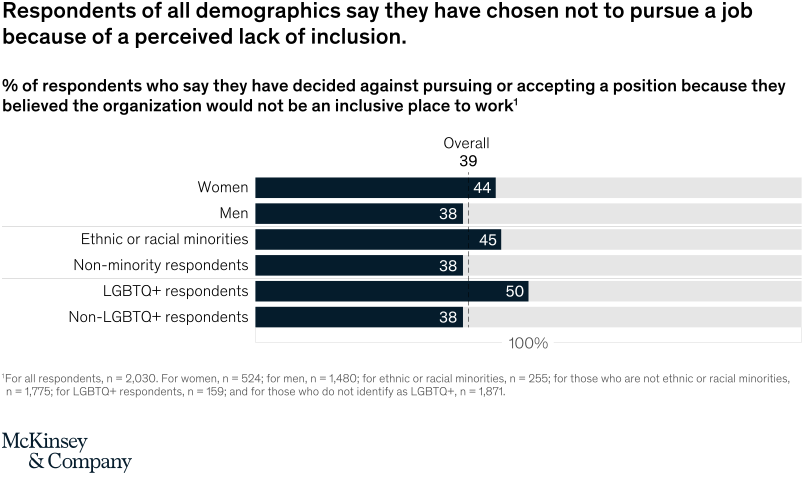
June 29, 2020 – LGBTQ+ and racial- or ethnic-minority candidates are more likely than others to report choosing not to pursue a job because they perceive an organization as noninclusive.
To read the survey, see “Understanding organizational barriers to a more inclusive workplace,” June 23, 2020.
customizer here
Visual form
Bar Chart: horizontal demographic comparison of job decisions affected by perceived lack of inclusion.
Layout / body structure
Each row is a demographic group, and each horizontal bar shows the share of respondents who chose not to pursue or accept a job because they believed the organization would not be inclusive. A dotted vertical reference marks the overall respondent level.
What is being compared
It compares how perceived lack of inclusion affects job pursuit or acceptance across overall respondents, women, men, ethnic or racial minorities, nonminority respondents, LGBTQ+ respondents, and non-LGBTQ+ respondents.
Measurement system
The measure is percent of respondents in each group. Bar length encodes the share affected, and the dotted reference line anchors the overall 39 percent benchmark.
Visible structure inside the graphic
LGBTQ+ respondents have the longest bar, followed by ethnic or racial minorities and women. Men, nonminority respondents, and non-LGBTQ+ respondents sit closer to or below the overall reference line.
Main takeaway from the visual
The chart shows that inclusion affects the size and quality of the hiring pool. A perceived lack of inclusion causes many candidates to walk away, with the strongest effect among LGBTQ+ respondents and ethnic or racial minorities.
Key standout values or extremes
The overall figure is 39 percent. LGBTQ+ respondents are highest at 50 percent, ethnic or racial minorities are 45 percent, and women are 44 percent.
Controls / sequence, when applicable
This is a static horizontal bar chart; there are no in-chart controls to operate.
Companion media, when applicable
There is no separate companion audio or video; the horizontal bar chart is the full visual on this page.