Source page: McKinsey & Company
Commentary
OEMs rock down to Electric Avenue
Mobility | North America
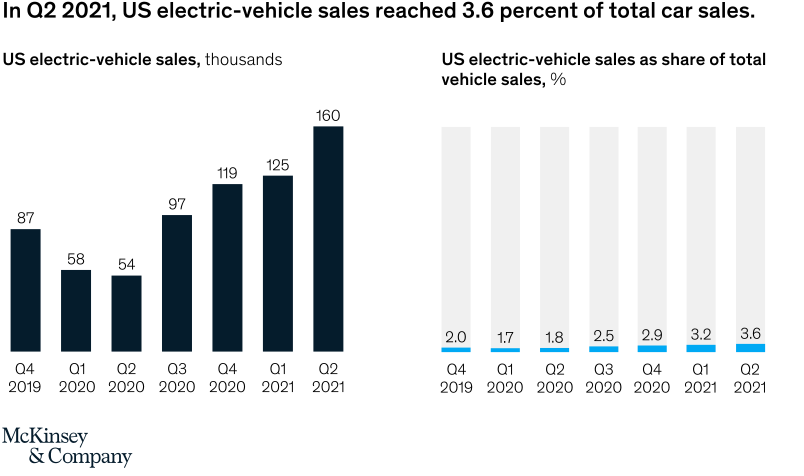
October 12, 2021 – Despite the COVID-19 pandemic, sales of electric vehicles (EVs) surged. EV sales increased nearly 200 percent between the second quarter 2020 and the second quarter 2021. US dealerships must prepare for the coming change as the popularity of EVs increase.
To read the article, see “A turning point for US auto dealers: The unstoppable electric car,” September 23, 2021.
customizer here
Visual form
Two-panel bar chart.
Layout / body structure
The chart places two time-series panels side by side. Read the left panel first for quarterly electric-vehicle sales in thousands, then move to the right panel for the same quarters shown as electric-vehicle share of total vehicle sales.
What is being compared
Both panels compare the same seven quarters from Q4 2019 through Q2 2021. The left side tracks absolute US electric-vehicle sales volume, while the right side tracks electric-vehicle sales as a percentage of all vehicle sales.
Measurement system
The left panel is measured in thousands of vehicles and labels each bar directly with its value. The right panel is measured in percent share of total vehicle sales and prints each quarter’s percentage at the base of a pale 100-percent column.
Visible structure inside the graphic
The left panel uses dark vertical bars labeled 87, 58, 54, 97, 119, 125, and 160 across the seven quarters. The right panel mirrors the same quarter sequence with light background columns and short blue base segments labeled 2.0, 1.7, 1.8, 2.5, 2.9, 3.2, and 3.6.
Main takeaway from the visual
The paired panels show a sharp electric-vehicle acceleration by mid-2021: quarterly unit sales recover from the 2020 dip and climb to a new high, while market share rises in parallel to its strongest level on the chart.
Key standout values or extremes
The lowest unit point is 54 thousand in Q2 2020, and the highest is 160 thousand in Q2 2021. On the share side, the series bottoms at 1.7 percent in Q1 2020 and rises to 3.6 percent in Q2 2021, the headline value called out at the top of the page.
Controls / sequence, when applicable
This is a static chart image with no in-chart controls to operate.
Companion media, when applicable
There is no separate companion audio or video; the chart image is the full visual on this page.