Source page: McKinsey & Company
Commentary
Online learning gets failing grades from teachers across the globe
COVID-19 | Remote learning
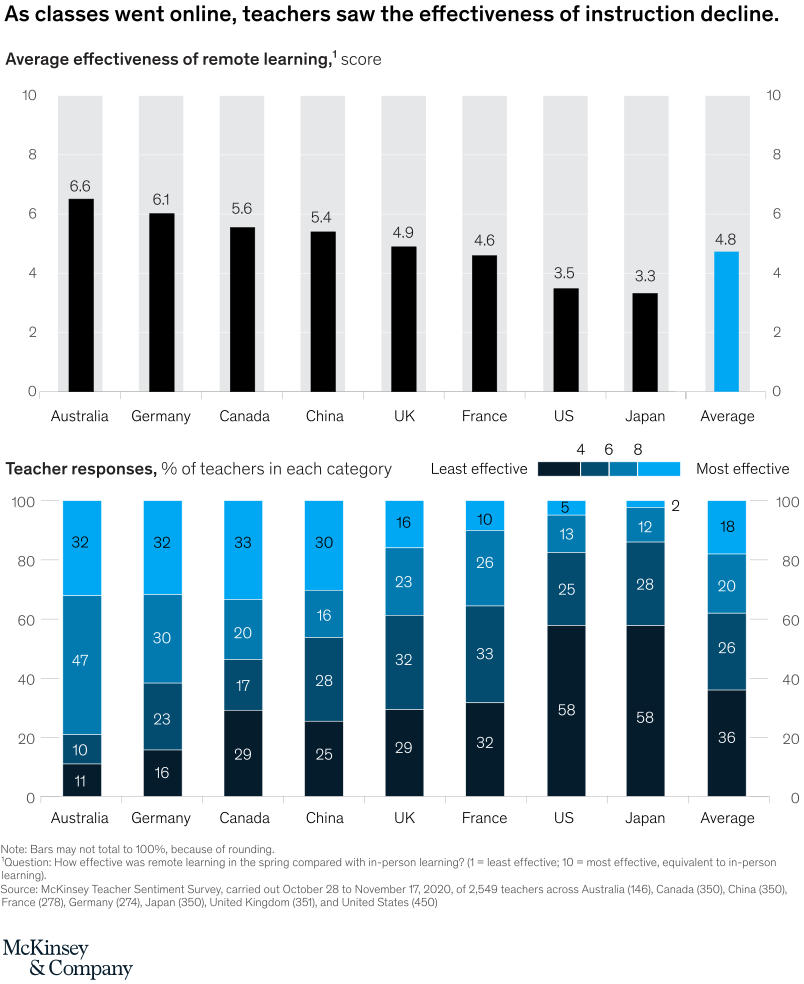
March 17, 2021 – We asked over 2,500 teachers to rank the effectiveness of remote learning on a scale of one to ten—with one being least effective—and the average score was 4.8. Compared to their peers, teachers in Japan and the US rated online learning as much less effective than in-person instruction.
To read the article, see “Teacher survey: Learning loss is global—and significant,” March 1, 2021
customizer here
Visual form
Two-part country comparison chart combining bars and stacked columns.
Layout / body structure
The chart begins with a top row of country bars showing average effectiveness scores for remote learning, then moves to a lower row of 100 percent stacked columns showing teacher response distributions for the same countries. Reader compares the top averages first and then uses the lower stacks to see how much of each country’s responses cluster at low versus high effectiveness ratings.
What is being compared
It compares countries on teachers’ ratings of remote-learning effectiveness in the spring relative to in-person instruction. The countries shown are Australia, Germany, Canada, China, the UK, France, the US, Japan, and the overall average.
Measurement system
The top measure is an average effectiveness score on a 1 to 10 scale, printed above each country bar. The lower measure is percent of teachers in each rating band, arranged from least effective to most effective in stacked columns.
Visible structure inside the graphic
The top bars all sit against a common 0 to 10 frame, so the strongest and weakest countries stand out immediately. The lower panel repeats a consistent four-band stack for each country, making it easy to see where low-effectiveness responses dominate and where more positive assessments occupy a larger share.
Main takeaway from the visual
Teachers across the globe report a clear drop in instructional effectiveness once classes moved online, with the overall average settling below the midpoint of the 10-point scale. The stacked columns reinforce that message because many countries have large shares of responses clustered in the low-effectiveness bands.
Key standout values or extremes
Australia leads the top panel at 6.6, followed by Germany at 6.1 and Canada at 5.6, while the US and Japan are lowest at 3.5 and 3.3; the overall average is 4.8. In the lower panel, the US and Japan each show 58 percent in the lowest-effectiveness band, while Australia has the highest top-band share at 32 percent.
Controls / sequence, when applicable
This is a static chart image with no in-chart controls to operate.
Companion media, when applicable
There is no separate companion audio or video; the chart image is the full visual on this page.