Source page: McKinsey & Company
Commentary
Pandemic now an 'also-ran' in economic worries
COVID-19 | Economy
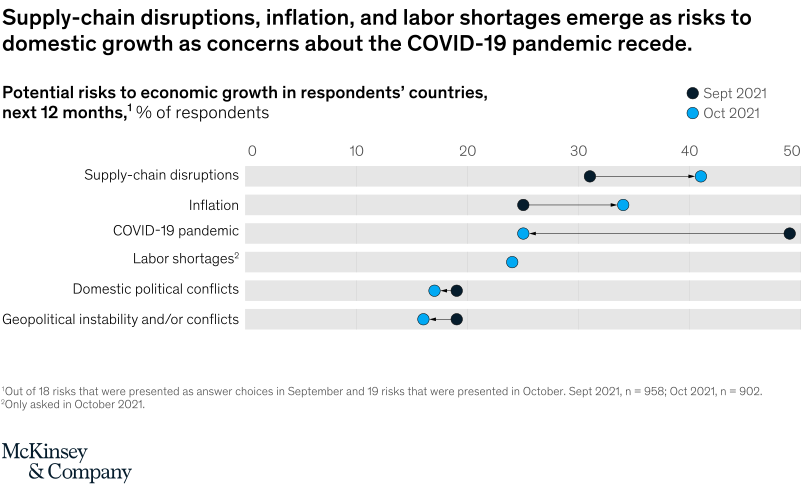
November 15, 2021 – Inflation and supply-chain disruptions have overtaken the COVID-19 pandemic itself as the biggest potential hindrance to domestic and corporate growth, according to executives in the latest McKinsey Global Survey. Only a quarter of respondents now say the pandemic is the most significant risk to domestic growth in their countries, compared with half who did so in September 2021.
To read the survey, see “The coronavirus effect on global economic sentiment,” October 29, 2021.
customizer here
Visual form
Paired-dot comparison chart.
Layout / body structure
The chart is a single horizontal list of six risk categories, each row holding a dark dot for September 2021 and a blue dot for October 2021 connected by a short directional line. Reader moves top to bottom through the risk list and compares how far each pair shifts between the two months.
What is being compared
The chart compares respondents’ perceived risks to economic growth in their countries over the next 12 months. It contrasts September 2021 and October 2021 readings for supply-chain disruptions, inflation, the COVID-19 pandemic, labor shortages, domestic political conflicts, and geopolitical instability or conflicts.
Measurement system
The horizontal axis measures percent of respondents on a 0 to 50 scale. Each row uses two plotted points to show the month-to-month level and a connecting line with an arrow to show the direction of change.
Visible structure inside the graphic
The top rows sit farthest to the right and represent the biggest cited risks, with supply-chain disruptions and inflation near the 30-to-40 range. The COVID-19 pandemic row shows the most dramatic reversal, moving from a dark September point near 50 down to a blue October point near the mid-20s, while labor shortages appear only as a blue October dot because that question was added later.
Main takeaway from the visual
Economic worries shifted away from the pandemic and toward supply chains, inflation, and labor shortages. The visual makes that transition obvious by showing COVID-19 dropping sharply while supply-chain disruptions and inflation move up and occupy the highest rows on the chart.
Key standout values or extremes
COVID-19 pandemic falls from roughly 49 percent in September to about 25 percent in October, which is the largest visible month-to-month change. Supply-chain disruptions rise to around 41 percent and inflation to around 34 percent in October, while domestic political conflicts and geopolitical instability cluster much lower around the mid-to-high teens.
Controls / sequence, when applicable
This is a static chart image with no in-chart controls to operate.
Companion media, when applicable
There is no separate companion audio or video; the chart image is the full visual on this page.