Source page: McKinsey & Company
Commentary
Panic, neglect, panic, neglect: How to break the cycle
COVID-19 | Public Health
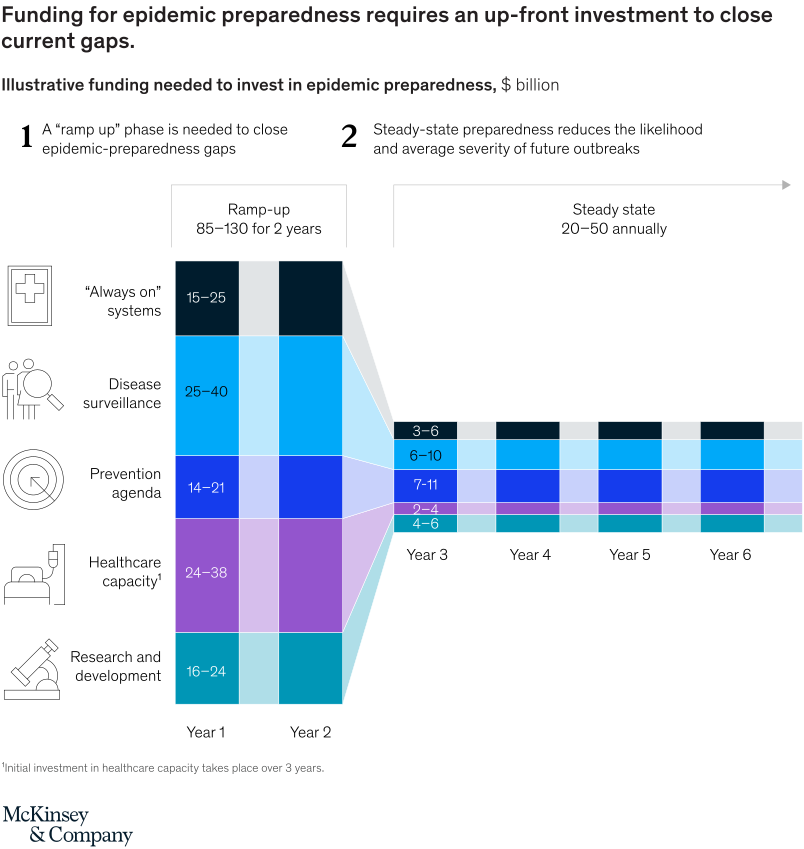
June 3, 2021 – COVID-19 exposed some gaps in the world’s pandemic preparations. To close those will require substantial investment in the next couple of years, and then a smaller steady-state investment in following years. In our estimate, investment on this scale could substantially reduce the likelihood of future pandemics.
To read the article, see “Not the last pandemic: Investing now to reimagine public-health systems,” May 21, 2021.
customizer here
Visual form
Two-stage stacked funding bridge chart.
Layout / body structure
The chart is split into an up-front ramp-up phase on the left and a steady-state preparedness phase on the right, with the same five preparedness pillars carried across both parts. Read the two large year blocks first, then follow the color-matched ribbons into the repeated annual bars for years 3 through 6.
What is being compared
The chart compares funding needed for epidemic preparedness during an initial gap-closing ramp-up period versus the lower but continuing annual funding needed in steady state. It also compares the five preparedness pillars inside both phases: always on systems, disease surveillance, prevention agenda, healthcare capacity, and research and development.
Measurement system
The values are measured in billions of dollars. The left side gives yearly ramp-up ranges for each pillar in years 1 and 2, while the right side shows recurring annual ranges for years 3 to 6, with each color block labeled directly inside the stack.
Visible structure inside the graphic
The left half uses two tall stacked columns for years 1 and 2, and the right half uses four shallower repeated annual stacks for steady state. Broad color ribbons connect the tall left stacks to the shorter right stacks, visually encoding the drop from one-time catch-up spending to lower recurring preparedness costs across the same five pillars.
Main takeaway from the visual
Epidemic preparedness needs a large up-front spending surge to close current gaps, followed by a smaller but ongoing annual commitment to avoid falling back into neglect. The bridge from the tall left-side stacks to the shorter repeated right-side stacks makes the cycle-break logic visible instead of leaving it as a verbal claim.
Key standout values or extremes
The overall ramp-up phase is estimated at 85 to 130 billion dollars for two years, while the steady-state requirement drops to 20 to 50 billion dollars annually. Within the ramp-up stack, healthcare capacity is one of the largest components at 24 to 38, disease surveillance runs at 25 to 40, prevention agenda at 14 to 21, research and development at 16 to 24, and always on systems at 15 to 25. In steady state, the repeated annual ranges tighten to 3 to 6 for always on systems, 6 to 10 for disease surveillance, 7 to 11 for prevention agenda, 0 to 4 for healthcare capacity, and 4 to 6 for research and development.
Controls / sequence, when applicable
This is a static chart image with no in-chart controls to operate.
Companion media, when applicable
There is no separate companion audio or video; the chart image is the full visual on this page.