Source page: McKinsey & Company
Commentary
Pharma’s Rx for R&D
Life Sciences | Pharmaceuticals & Medical Products
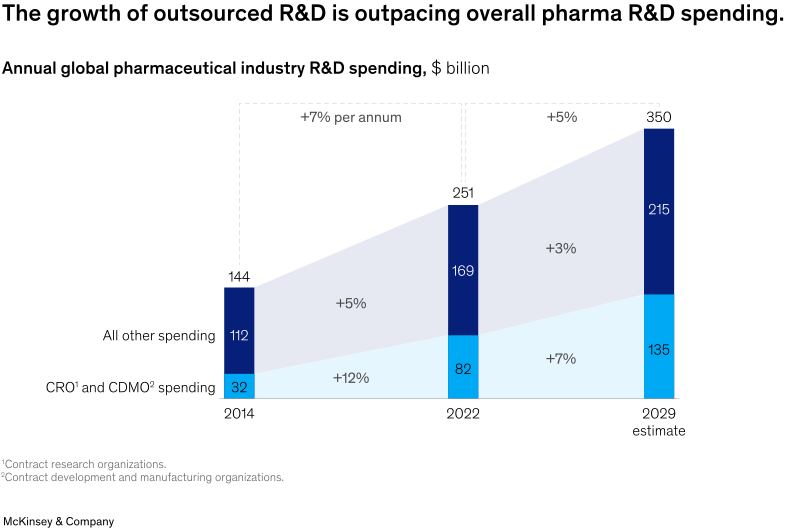
February 11, 2025 – The average cost to develop a drug is $2.3 billion, and an increasing share of that spending has gone to contract research organizations (CROs) and contract development and manufacturing organizations (CDMOs) in recent years. From 2014 to 2022, CRO and CDMO spending increased by about 13 percent annually, compared with about 8 percent for overall R&D spending. Senior Partner Gaurav Agrawal and coauthors note that this outsourcing trend could accelerate, with CRO and CDMO spending projected to more than double the 2014 total within the next four years.
To read the article, see “Building a shared vision for pharma R&D–supplier partnerships,” January 9, 2025.
customizer here
Visual form
Stacked column chart with growth overlays.
Layout / body structure
The chart is a three-point time comparison using stacked columns for 2014, 2022, and the 2029 estimate. Read the columns left to right, then compare the lower outsourced-R&D segment against the upper all-other-spending segment and the growth annotations that sit across the shaded bands.
What is being compared
It compares total global pharmaceutical industry R&D spending with the outsourced CRO and CDMO portion separated from all other R&D spending. The chart shows how each component grows over time and how the outsourced portion gains share within the total.
Measurement system
The columns are measured in billions of dollars, with totals shown above the stacks and segment values printed inside the bars. Growth annotations are expressed as annual percentage rates for the total market and for the two component layers.
Visible structure inside the graphic
The chart is organized as three stacked columns connected by broad shaded bands that visually bridge the component growth from one period to the next. The lower blue segment isolates CRO and CDMO spending, while the darker upper segment represents all other R&D spending.
Main takeaway from the visual
The visual shows that outsourced R&D is growing faster than the overall pharmaceutical R&D market and therefore taking a larger share of the total over time. The lower segment expands more quickly between each benchmark year, while the annotations show stronger growth for outsourced activity than for the upper all-other-spending segment.
Key standout values or extremes
Total R&D spending rises from 144 billion dollars in 2014 to 251 billion in 2022 and an estimated 350 billion in 2029. The outsourced CRO and CDMO segment climbs from 32 to 82 to 135 billion dollars, with 12 percent growth in the first period and 7 percent in the second, versus 5 percent and 3 percent for the all-other-spending layer above it.
Controls / sequence, when applicable
This is a static chart image with no in-chart controls to operate.
Companion media, when applicable
There is no separate companion audio or video; the chart image is the full visual on this page.