Source page: McKinsey & Company
Commentary
Pickleball nets fans
Retail | Sports
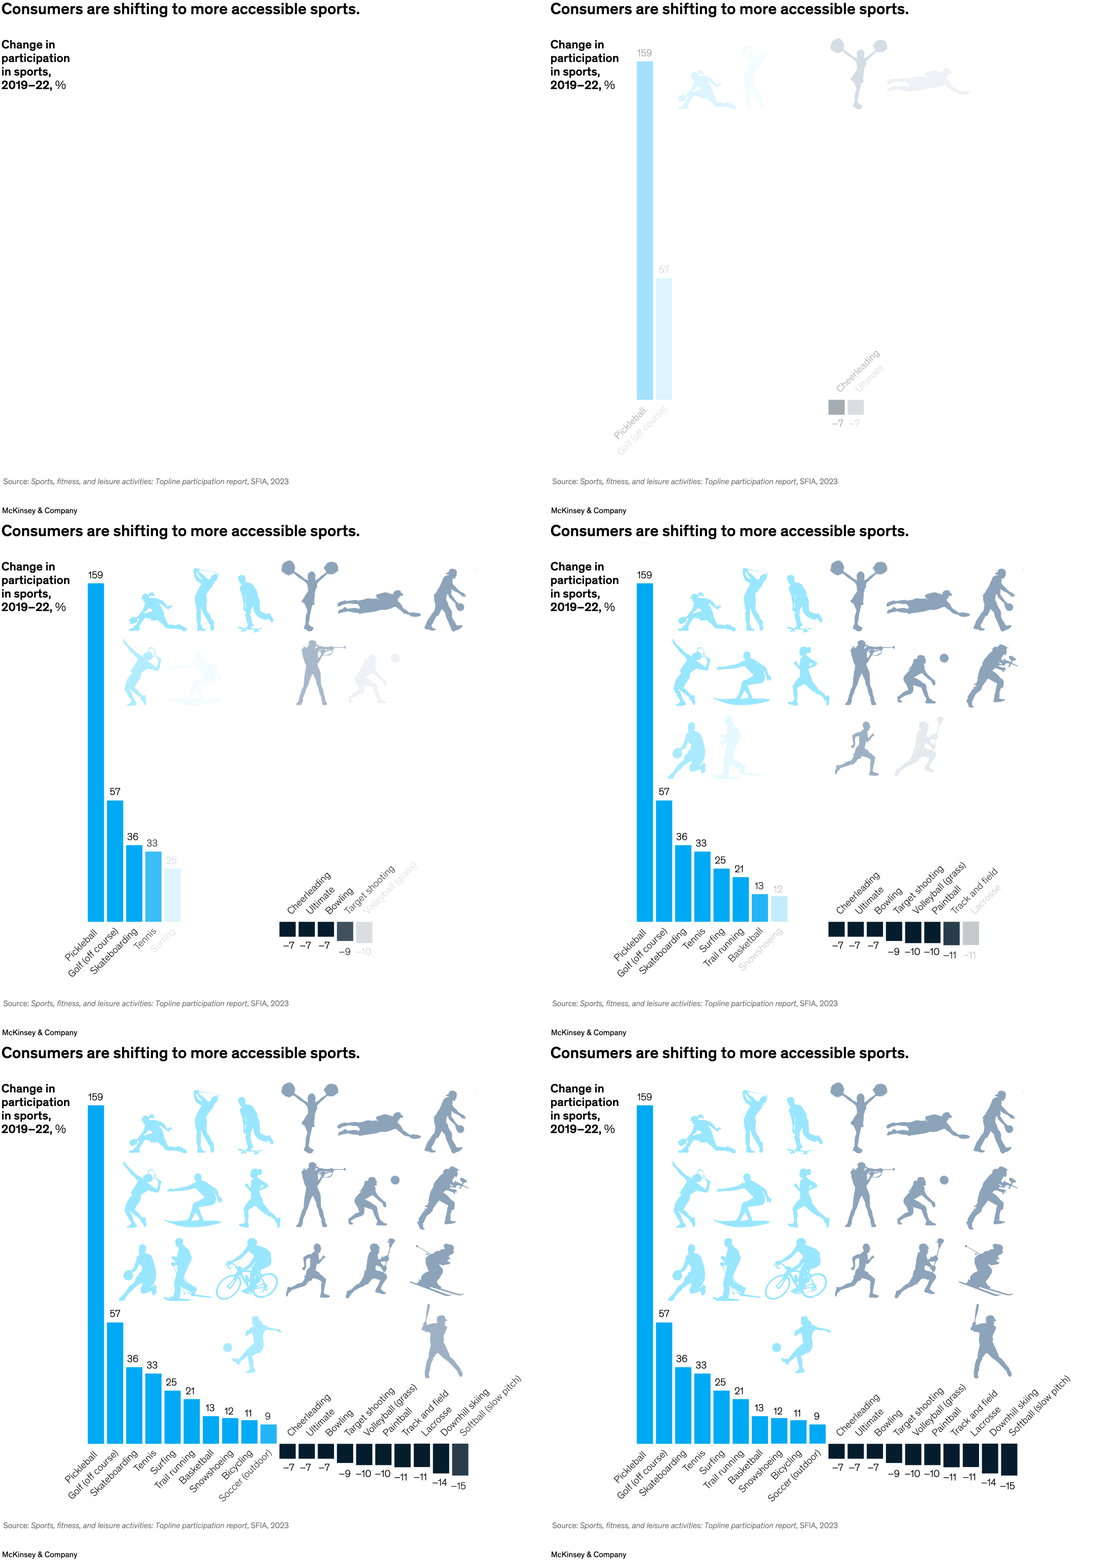
March 1, 2024 – The sporting goods sector has shown resilience despite subdued consumer confidence in recent years. Although participation in organized sports has declined, senior partner Gemma D’Auria and coauthors note, consumers instead are favoring more accessible activities. Pickleball participation has shot up 159 percent from 2019 to 2022, and off-course golf grew 57 percent during that span.
To read the report, see “Time to move: Sporting goods 2024,” January 30, 2024.
customizer here
Visual form
Single bar chart with icon illustrations.
Layout / body structure
A ranked bar chart runs across the lower half of the page while sport silhouettes fill the upper field, so the reader reads the bars first and then connects them to the activity icons.
What is being compared
It compares changes in participation across sports from 2019 to 2022, separating fast-growing accessible activities from sports that lost participation.
Measurement system
The vertical measure is percentage change in participation, with positive gains shown as tall light-blue bars and declines shown as darker bars below zero.
Visible structure inside the graphic
Bars are ordered from the largest gain to the sharpest decline, each bar is labeled with its sport and value, and the surrounding silhouettes visually group the activities on the page.
Main takeaway from the visual
The chart makes the shift toward easier-entry sports obvious, because the strongest gains sit in pickleball, golf, skateboarding, and other casual or flexible activities, while several more structured sports move backward.
Key standout values or extremes
Pickleball leads by a wide margin at 159 percent, followed by golf at 57, skateboarding at 36, and tennis at 33, while track and field is down 11, lacrosse 14, and softball 15.
Controls / sequence, when applicable
This is a static chart image with no in-chart controls to operate.
Companion media, when applicable
There is no separate companion audio or video; the chart image is the full visual on this page.