Source page: McKinsey & Company
Commentary
Private equity slows its roll
Private equity | Banking
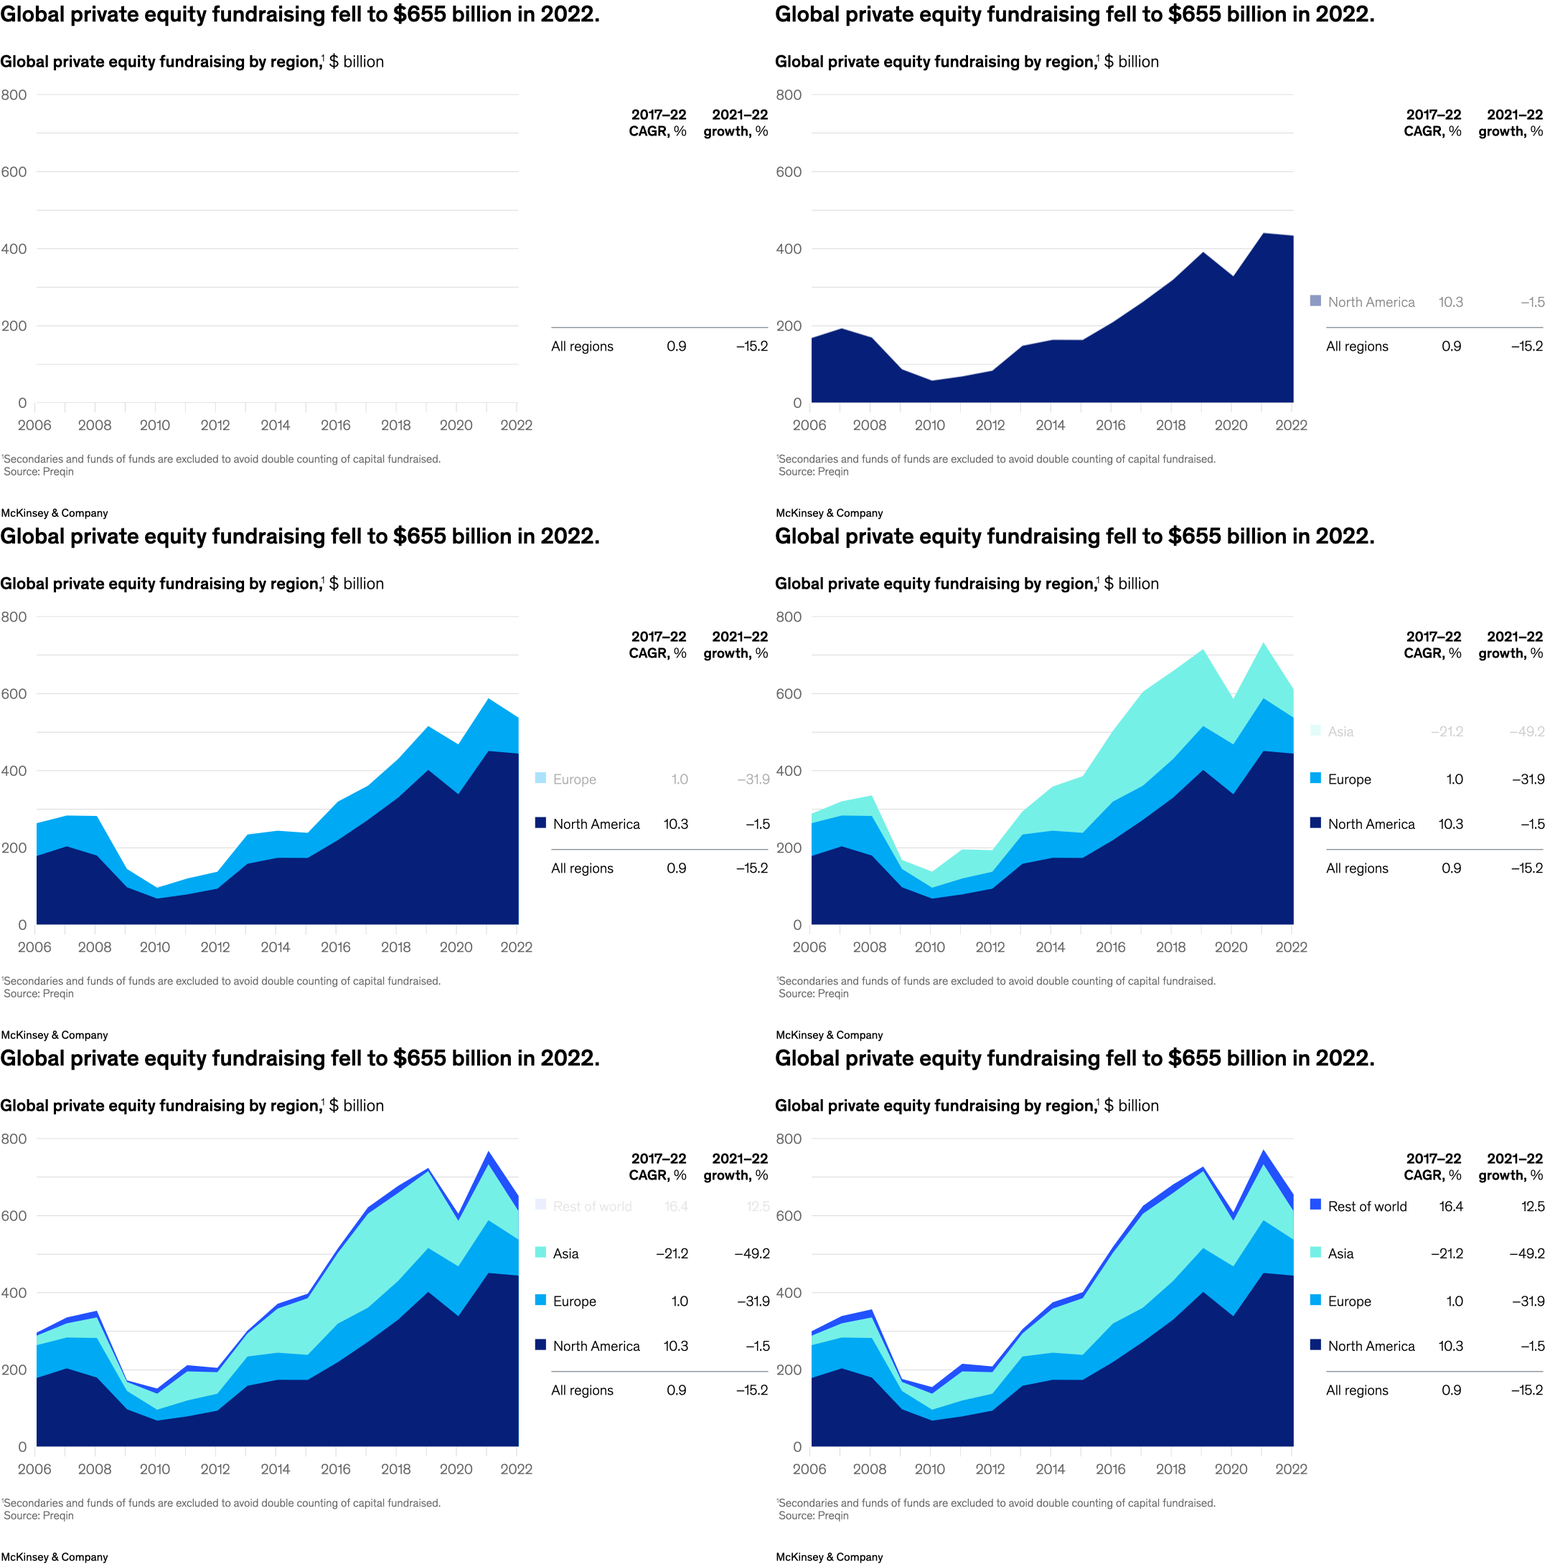
April 19, 2023 – Private equity fundraising had a banner year in 2021, reaching all-time highs before falling 15 percent, to $655 billion, last year. Senior partner Pontus Averstad and coauthors point to macroeconomic uncertainty, higher cost of debt, and sharply declining public market valuations as main causes of the stifled growth.
To read the report, see “McKinsey Global Private Markets Review: Private markets turn down the volume,” March 21, 2023.
customizer here
Visual form
Stacked area time series with side metric table.
Layout / body structure
A single time-series plot runs from 2006 to 2022 on the left, stacking regional fundraising areas over time, while a small summary table on the right reports CAGR and recent growth rates.
What is being compared
It compares global private-equity fundraising over time by region, with the visible chart focusing on North America and Europe while the table summarizes performance across all regions.
Measurement system
The vertical measure is billions of dollars raised, the horizontal measure is year, and the side table adds 2017 to 2022 CAGR plus 2021 to 2022 growth percentages.
Visible structure inside the graphic
The chart uses a dark base area for North America and a lighter top area for Europe, making it easy to see the total height of fundraising as well as the regional mix, while the right-hand text table translates the same story into compact growth statistics.
Main takeaway from the visual
Fundraising climbs to a high around 2021 and then drops in 2022, with the decline large enough to reverse part of the prior rise even though the long-run regional trend still sits above the early trough years.
Key standout values or extremes
The headline gives the 2022 total at 655 billion dollars; the table shows North America with a 10.3 percent CAGR from 2017 to 2022 and a negative 1.5 percent change from 2021 to 2022, Europe with 1.0 percent CAGR and negative 31.9 percent growth, and all regions with negative 15.2 percent growth in 2022.
Controls / sequence, when applicable
This is a static chart image with no in-chart controls to operate.
Companion media, when applicable
There is no separate companion audio or video; the chart image is the full visual on this page.