Source page: McKinsey & Company
Commentary
Productivity picks up the pace
Economy | Productivity
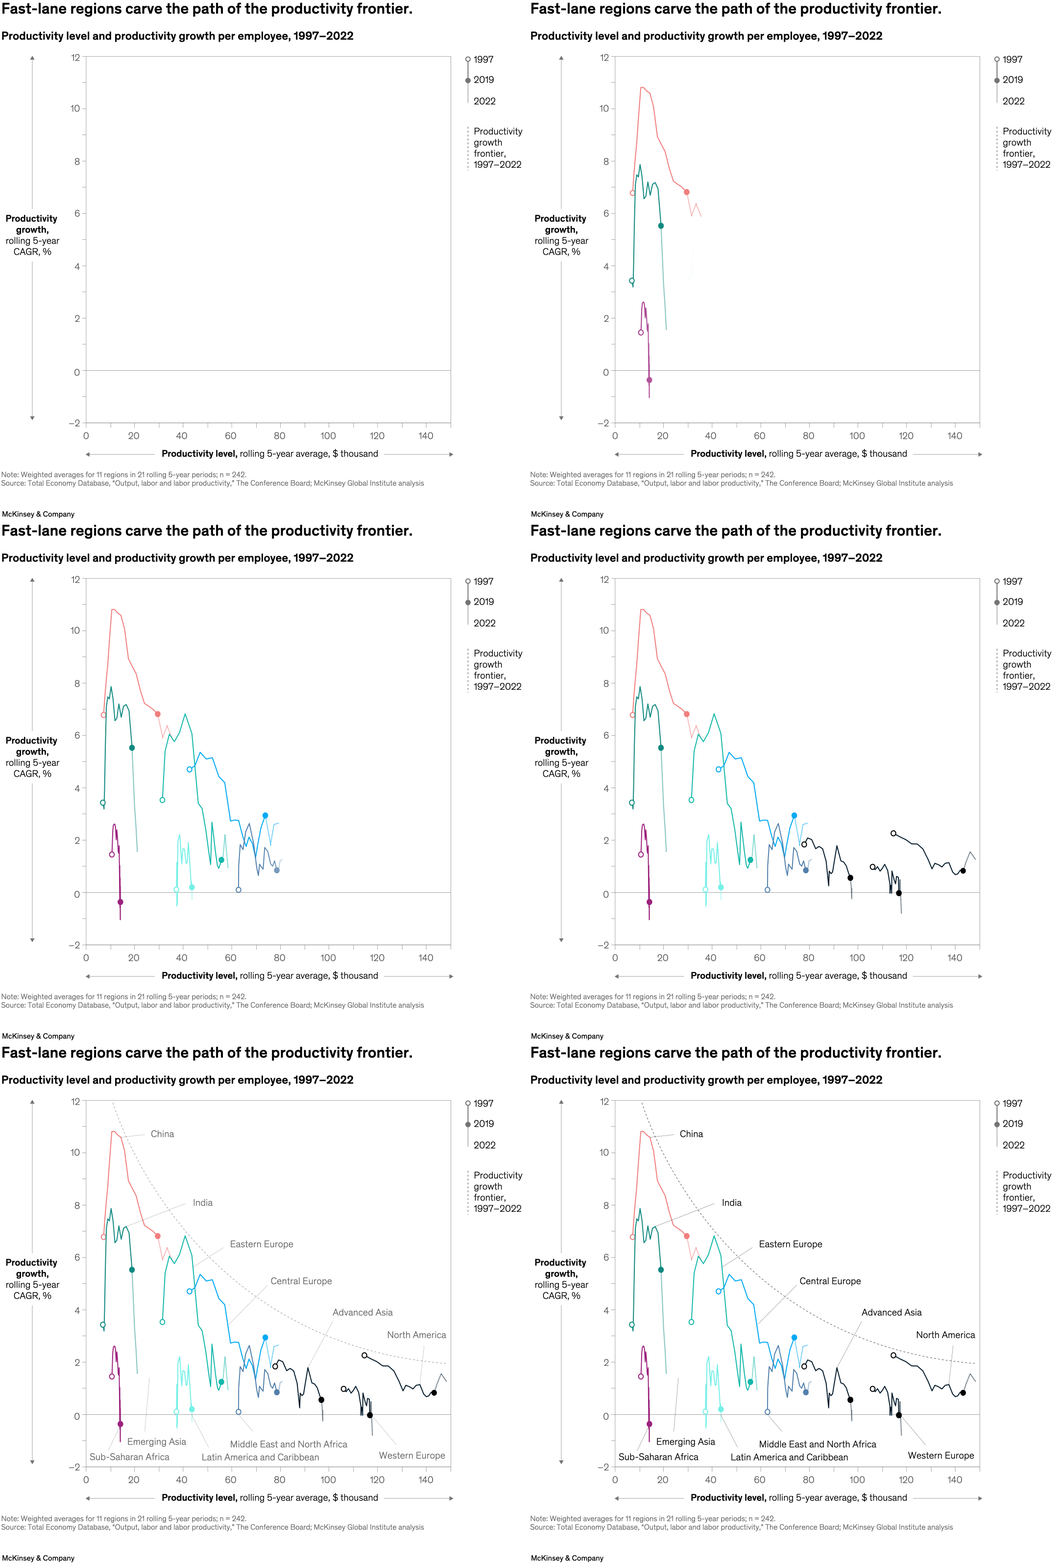
April 26, 2024 – Global productivity climbed sharply in the past 25 years, thanks in part to 30 “fast lane” economies—meaning those that could reach advanced-economy productivity levels in the next quarter century. Senior partner and McKinsey Global Institute chair Sven Smit and colleagues explain that some regions have achieved rapid progress since 1997: China demonstrated the highest growth rates and boosted output from $6,000 per worker to more than $40,000, while Central Europe doubled its output per worker to $80,000. Increasing capital per hour accounted for up to 80 percent of overall productivity growth across all regions.
To read the report, see “Investing in productivity growth,” March 27, 2024.
customizer here
Visual form
Scatter plot.
Layout / body structure
This is a single frontier-style chart with region traces and dots distributed across a productivity-growth field. The reading order is across the productivity-level axis first and then up the productivity-growth axis, with the labeled regional trajectories showing where different regions sit over time.
What is being compared
It compares productivity level and productivity growth per employee across regions from 1997 to 2022, showing which regions are closer to the frontier and which are moving faster.
Measurement system
The horizontal axis is productivity level and the vertical axis is productivity growth, with a dotted frontier line and year markers distinguishing the different points in time. The plot also references CAGR for productivity growth across the period.
Visible structure inside the graphic
The chart contains multiple colored regional paths, each labeled directly in the field. Some traces start lower and climb quickly, while others sit farther right with slower growth, and the dotted frontier line slopes down as productivity level increases.
Main takeaway from the visual
The visual shows that frontier regions tend to pair high productivity levels with lower marginal growth, while faster-moving catch-up regions such as China and India appear higher on the growth axis even when they sit left of the frontier leaders.
Key standout values or extremes
China is plotted near the highest productivity-growth readings on the chart, India also sits high relative to many peers, and regions such as North America and Advanced Asia sit farther right with stronger productivity levels but much lower growth rates than the catch-up group.
Controls / sequence, when applicable
This is a static chart image with no in-chart controls to operate.
Companion media, when applicable
There is no separate companion audio or video; the chart image is the full visual on this page.