Source page: McKinsey & Company
Commentary
Pumping the brakes on used-car prices
Automotive | Consumer
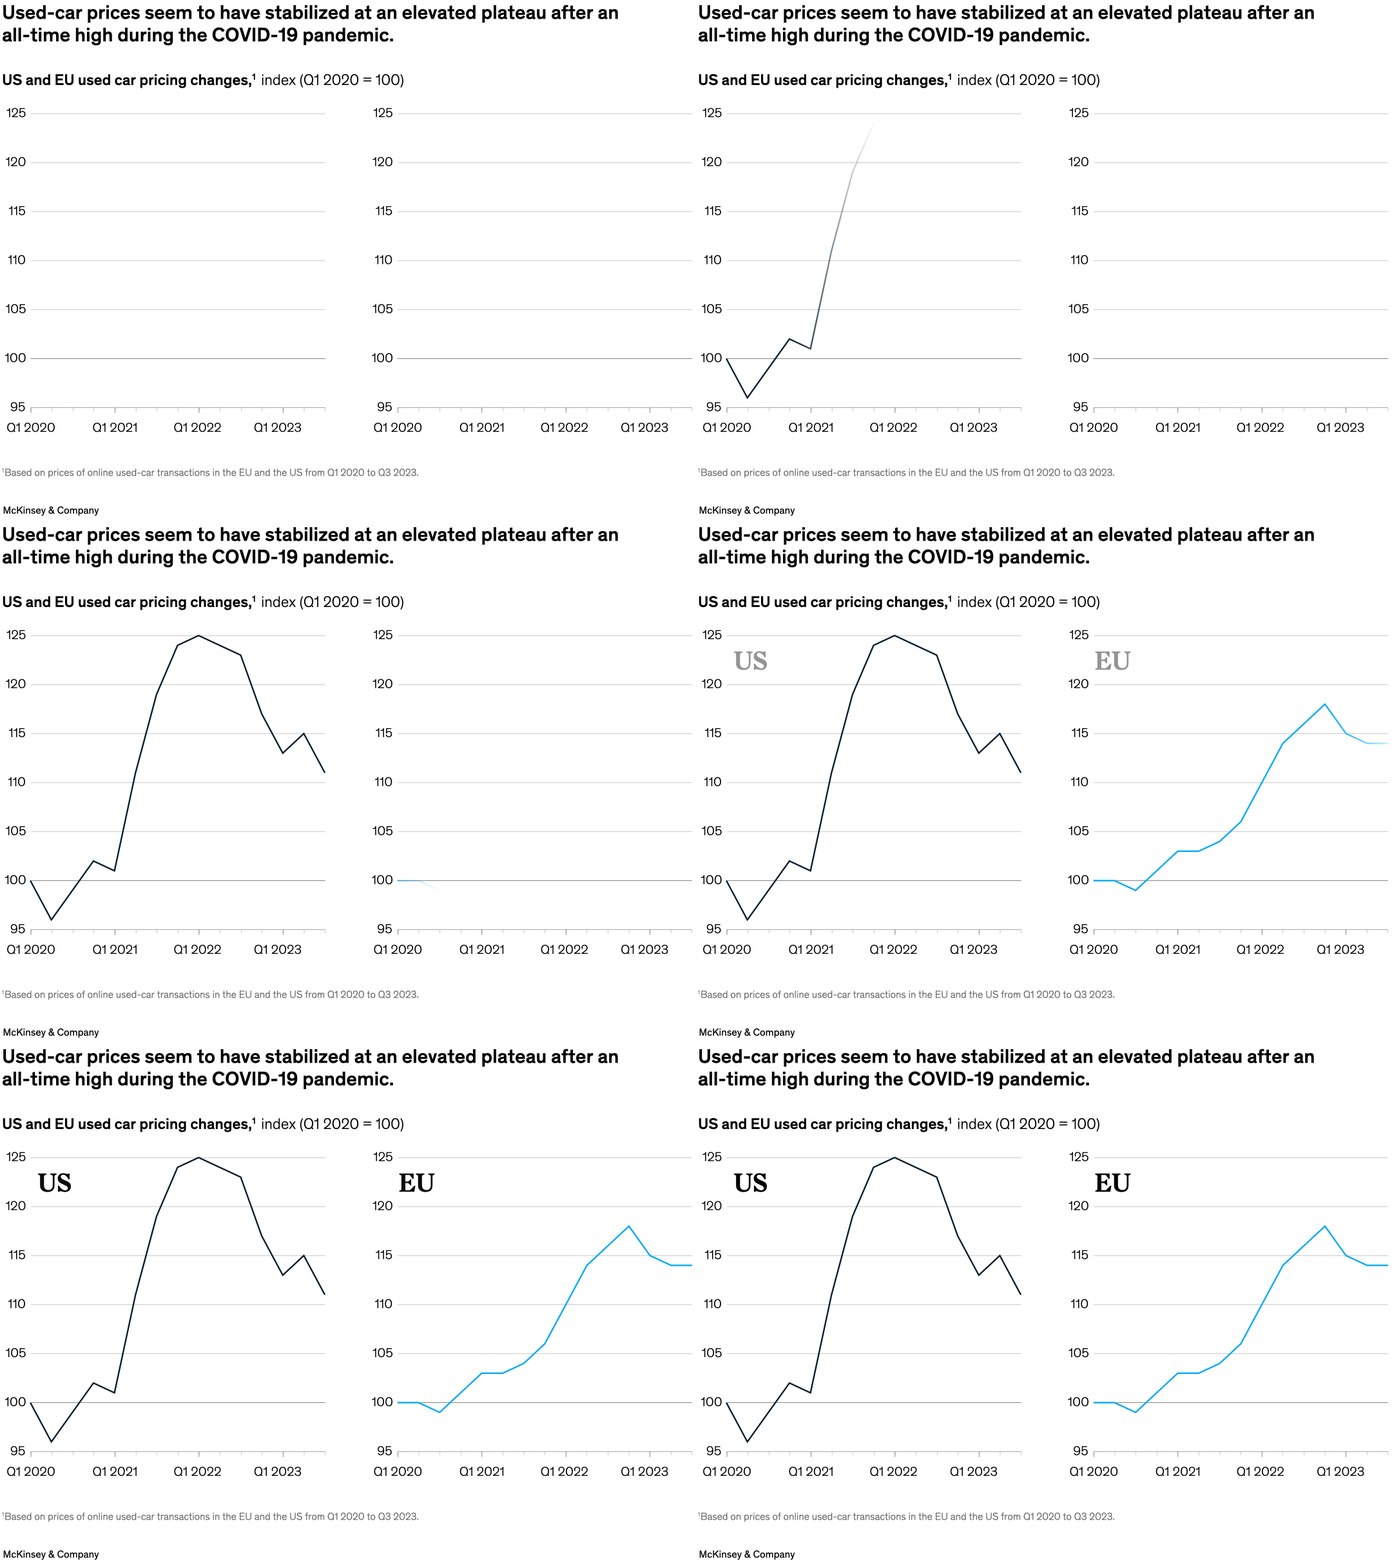
October 6, 2023 – A confluence of global challenges strained supply and boosted demand for used vehicles from 2020 to 2022. Since then, inflation has nudged down consumers’ purchasing power in many regions, pulling downward pressure on demand, senior partners Ben Ellencweig and Philipp Espel and colleagues explain. As a result, used-car prices appear to have stabilized, dropping from a peak last year.
To read the article, see “Data and analytics in the driver’s seat of the used-car market,” August 30, 2023.
customizer here
Visual form
Two-panel line chart. It compares used-car price movements across two markets on a shared index scale.
Layout / body structure
The page places two matching panels side by side, one for the US and one for the EU, with both charts running from Q1 2020 through Q3 2023. Reader scans left to right within each panel and then compares the two lines across the shared scale.
What is being compared
It compares used-car pricing changes over time in the US and the EU.
Measurement system
The y-axis is an index where Q1 2020 equals 100, and the x-axis tracks quarters from early 2020 to Q3 2023. The point is relative price movement above or below the starting baseline.
Visible structure inside the graphic
The chart uses two simple time-series panels with the same vertical range, so the reader can compare the shape of each market without recalibrating the scale. The twin-panel structure highlights both the pandemic spike and the later flattening.
Main takeaway from the visual
Used-car prices did not fully unwind after the pandemic surge; they leveled off at a higher plateau. The chart is built around that contrast between a sharp run-up and a later stabilization that still sits above the pre-pandemic baseline.
Key standout values or extremes
The title highlights the all-time-high period during the COVID-19 shock, and the plotted scale runs up to about 125, underscoring how far prices climbed above the 100 starting point. The important visual signal is that the lines remain elevated instead of dropping back to baseline.
Controls / sequence, when applicable
This is a static chart image with no in-chart controls to operate.
Companion media, when applicable
There is no separate companion audio or video; the chart image is the full visual on this page.