Source page: McKinsey & Company
Commentary
Quantum technologies' investment slump
Technology | Venture capital
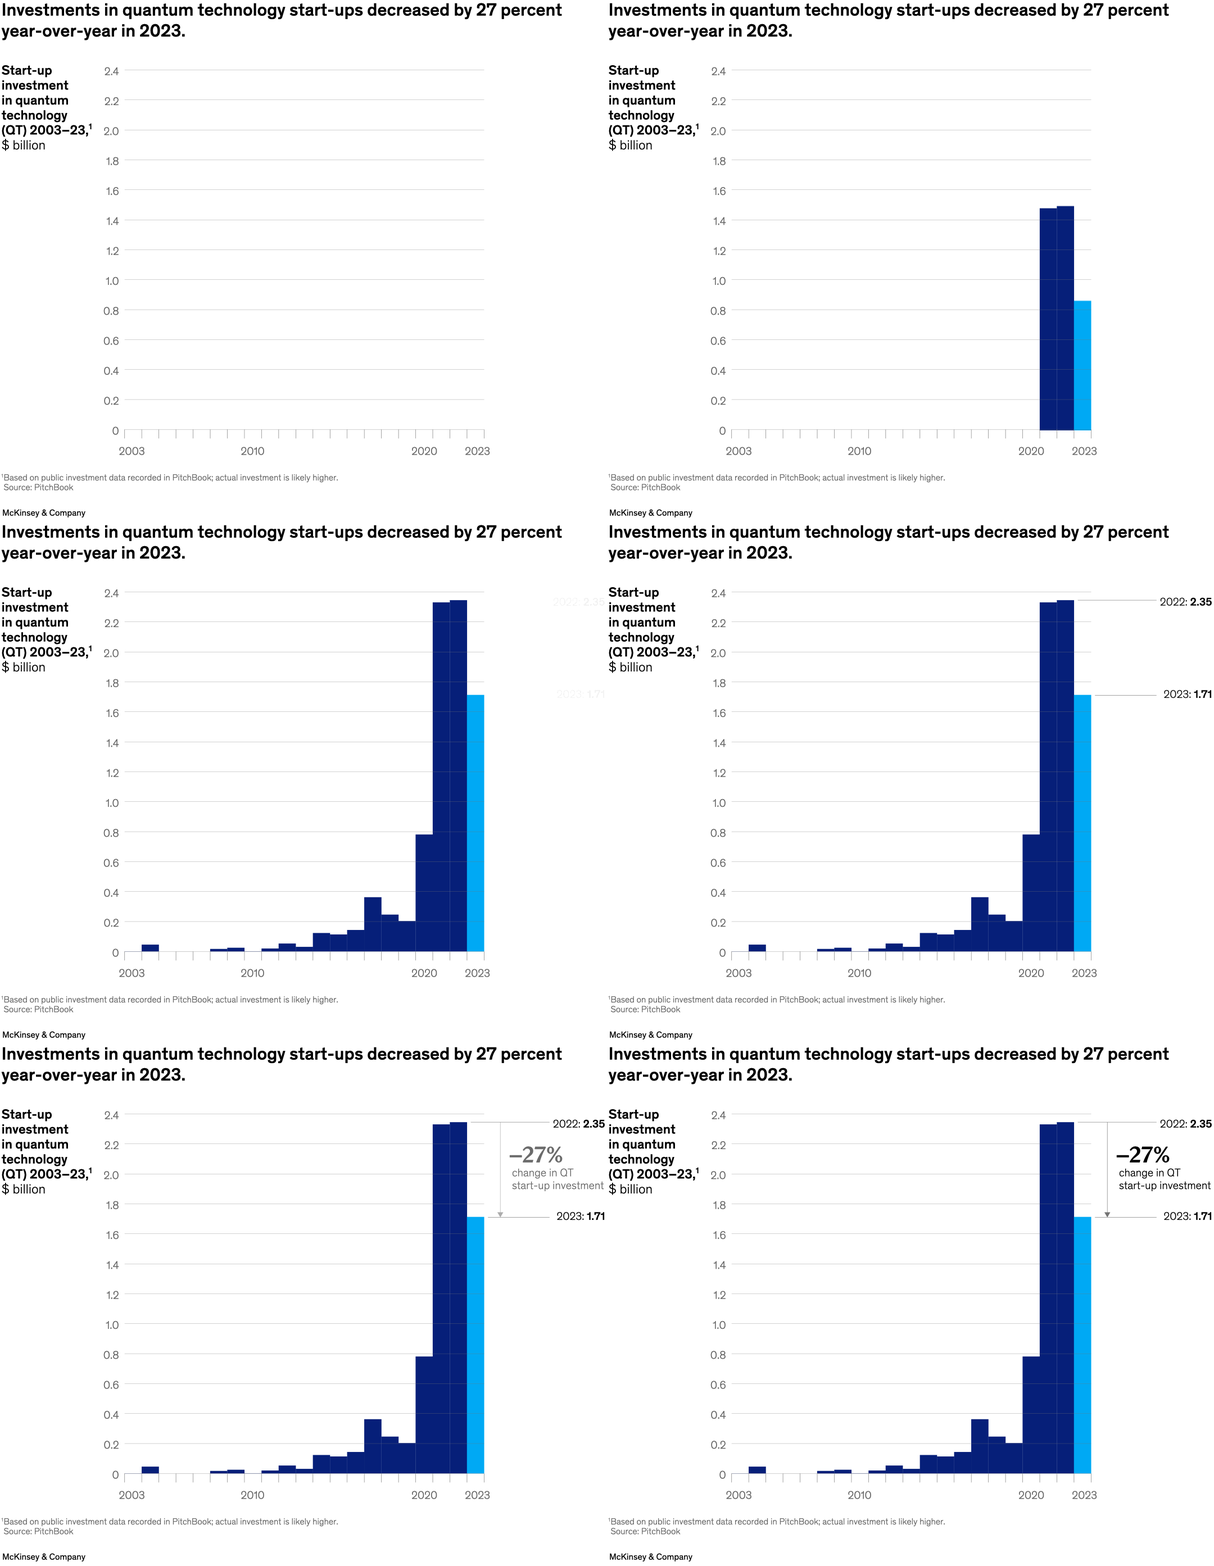
May 16, 2024 – Private and corporate funding for quantum technology start-ups slumped 27 percent in the past year, even as public investment surged. The decline in private investments, to $1.71 billion from the all-time high of $2.35 billion in 2022, was due in part to greater interest in generative AI technologies, senior partner Rodney Zemmel and colleagues explain. Investors may still be evaluating quantum technologies’ potential for use in various sectors in the long term.
To read the report, see “Steady progress in approaching the quantum advantage,” April 24, 2024.
customizer here
Visual form
Bar chart.
Layout / body structure
This is a single time-series bar chart running from 2003 to 2023, with the latest comparison called out on the right edge. The reading order moves left to right through the historical bars and then into the large year-over-year change annotation.
What is being compared
It compares annual start-up investment in quantum technology over time, with special emphasis on the drop from 2022 to 2023.
Measurement system
The y-axis is investment in billions of dollars and the x-axis is year. The bars encode annual totals, and the annotation on the right gives the 2022 and 2023 values and the percentage change between them.
Visible structure inside the graphic
A long sequence of short historical bars sits on the left half of the chart, followed by much taller bars in the early 2020s. The final two bars are highlighted by the side annotation showing the 2022 high and the 2023 pullback.
Main takeaway from the visual
The chart shows a steep investment build-up in the years leading into 2022, followed by a meaningful retreat in 2023 rather than a continuation of the previous peak.
Key standout values or extremes
The highest visible bar is 2022 at $2.35 billion, followed by 2023 at $1.71 billion. The callout marks that shift as a 27 percent year-over-year decline.
Controls / sequence, when applicable
This is a static chart image with no in-chart controls to operate.
Companion media, when applicable
There is no separate companion audio or video; the chart image is the full visual on this page.