Source page: McKinsey & Company
Commentary
Remote learning gets an “F” in poorer schools
Remote learning
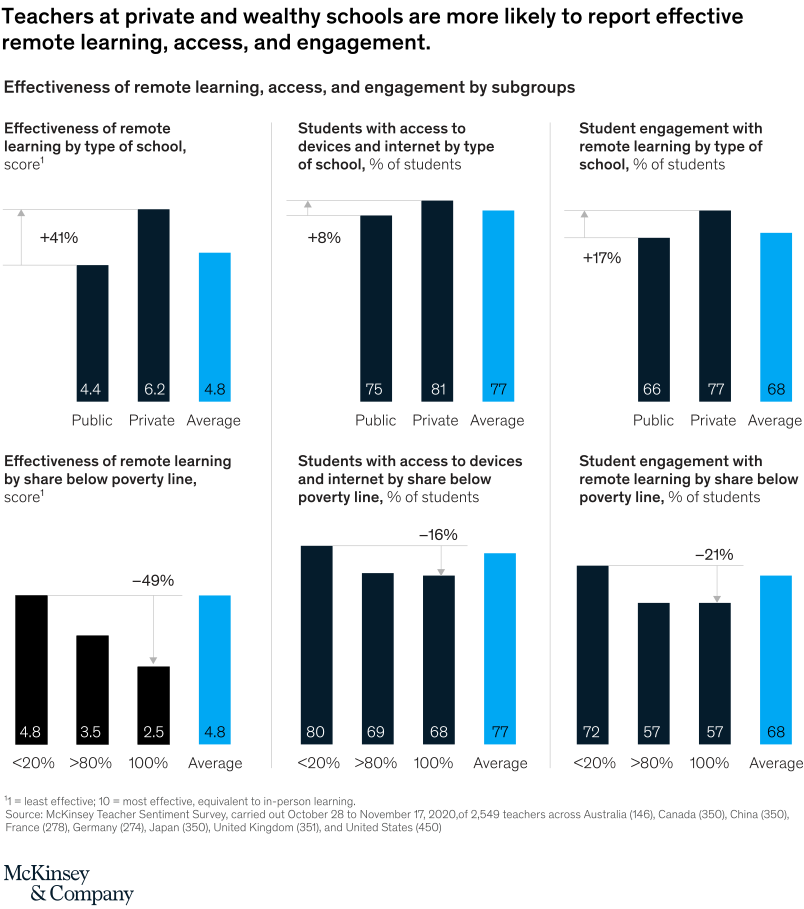
March 25, 2021 – Teachers working in poorer schools found virtual classes to be especially ineffective, rating it 3.5 out of 10. In contrast, teachers in private schools averaged a rating of 6.2. Resources make a difference—teachers in wealthy and private schools were also more likely to report that their students were well equipped with internet access and the devices required for remote learning, leading to higher engagement.
To read the article, see “Teacher survey: Learning loss is global—and significant,” March 1, 2021.
customizer here
Visual form
Six-panel grouped bar comparison chart.
Layout / body structure
The chart is arranged as two rows of three panels. The top row compares school-type differences in remote-learning effectiveness, access, and engagement, while the bottom row compares the same three dimensions by the share of students below the poverty line.
What is being compared
It compares remote-learning effectiveness, student access to devices and internet, and student engagement across private versus public schools and across schools with different poverty concentrations.
Measurement system
The top-left and bottom-left panels use effectiveness scores, while the other four panels use percentages of students. Each panel prints the values directly on the bars and adds a percentage-change annotation summarizing the gap between the contrasted groups.
Visible structure inside the graphic
Each panel uses a small set of vertical bars with a consistent average bar shown in blue for reference. The top row contrasts public and private schools, while the bottom row contrasts schools with less than 20 percent, greater than 80 percent, and 100 percent of students below the poverty line, making the widening gaps visible across multiple dimensions at once.
Main takeaway from the visual
Teachers at private and wealthier schools report stronger remote-learning effectiveness, better access, and higher engagement than teachers in poorer schools. The pattern repeats in every panel, so the visual reads as a broad structural gap rather than a one-off difference.
Key standout values or extremes
Remote-learning effectiveness is 4.4 in public schools versus 6.2 in private schools, a 41 percent lift. Access to devices and internet is 75 versus 81 by school type, and engagement is 66 versus 77; by poverty share, effectiveness drops from 4.8 at schools below 20 percent poverty to 2.5 at schools with 100 percent below poverty, while access falls from 80 to 68 and engagement from 72 to 57.
Controls / sequence, when applicable
This is a static chart image with no in-chart controls to operate.
Companion media, when applicable
There is no separate companion audio or video; the chart image is the full visual on this page.