Source page: McKinsey & Company
Commentary
Restaurants with contactless service could be better prepared to get sales back to precrisis levels
COVID-19 | Public Health | Reopening
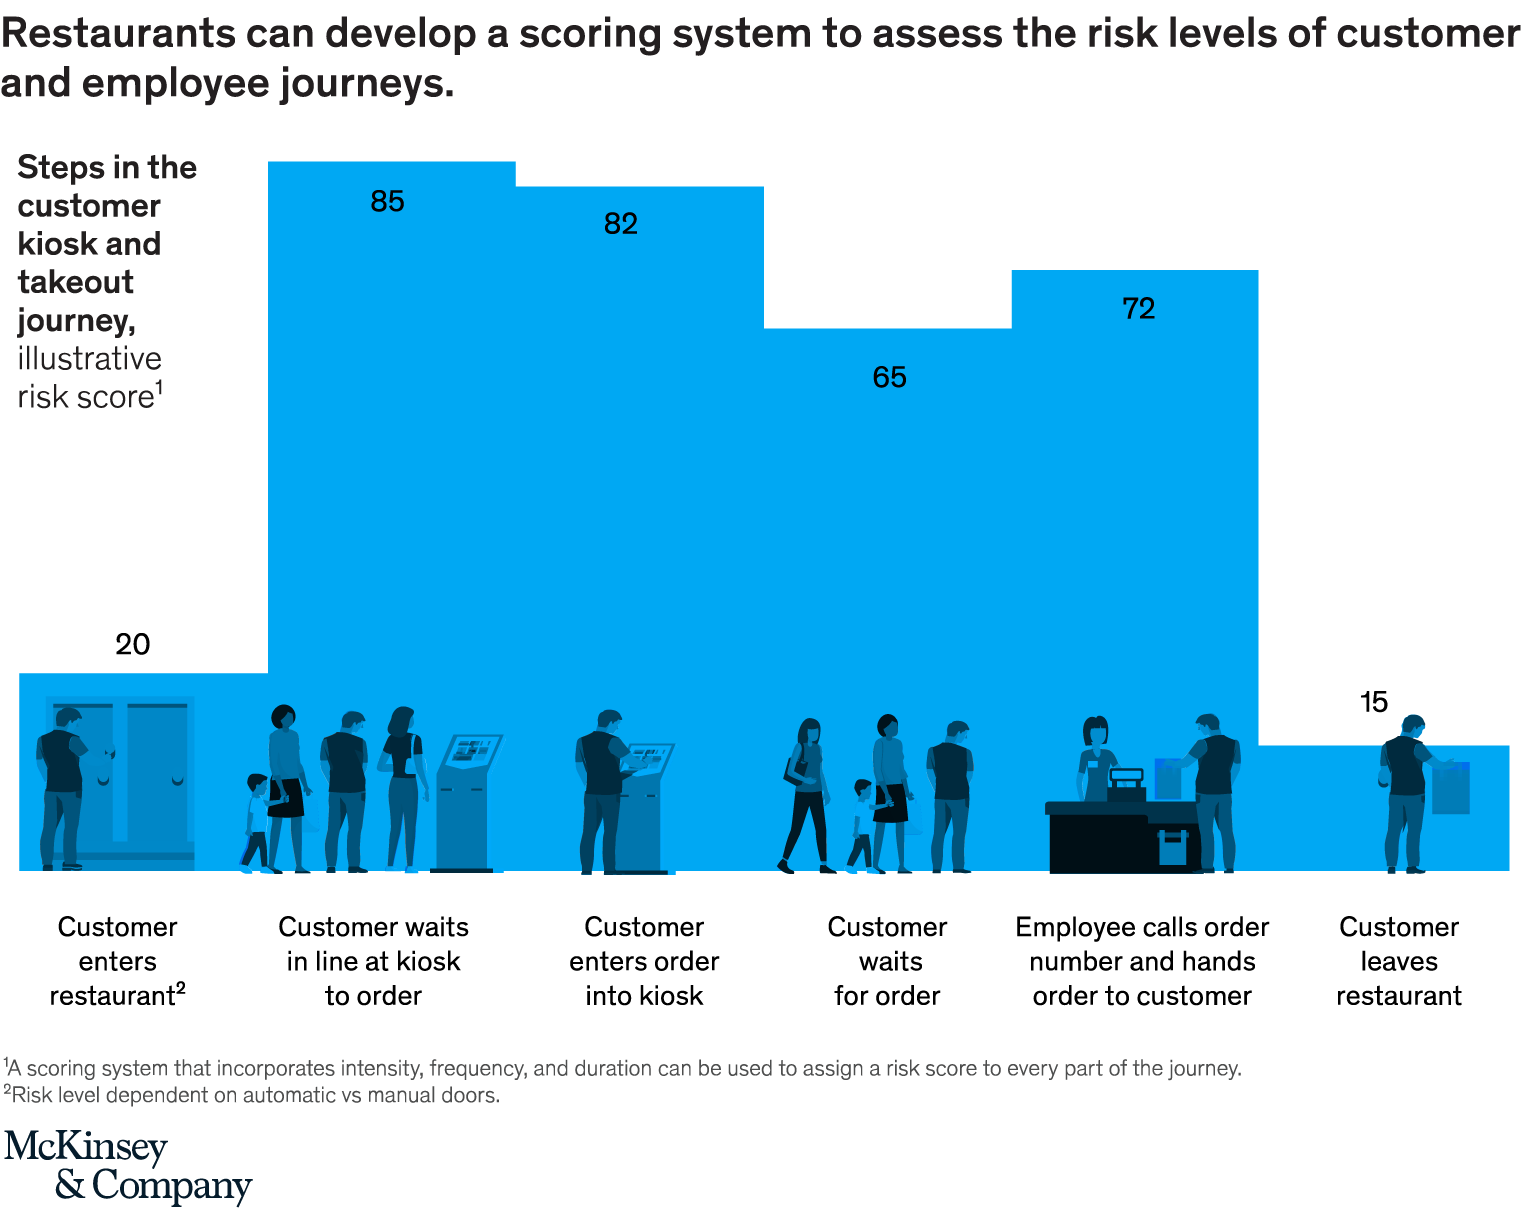
June 2, 2020 – By using a risk-scoring system that considers the intensity, frequency, and duration of interactions along the customer journey, restaurants can find ways to improve productivity and address health concerns.
To read the article, see “How restaurants can thrive in the next normal,” May 19, 2020.
customizer here
Visual form
Area Chart: stepped journey-risk score profile over a restaurant customer path.
Layout / body structure
The visual follows the customer journey from entering the restaurant through waiting, ordering at a kiosk, receiving the employee handoff, and leaving. A stepped blue area runs across those stages, with a risk score printed at each step.
What is being compared
It compares relative health-risk levels across the customer and employee interaction points in a restaurant service path. The comparison is stage by stage rather than by demographic group, geography, or calendar period.
Measurement system
The measure is an illustrative risk score based on the intensity, frequency, and duration of interactions. Higher scores indicate higher risk, so the area chart functions as a risk profile over the ordered journey.
Visible structure inside the graphic
The profile rises sharply during the waiting-in-line and kiosk-order stages, remains elevated around the employee handoff, and drops at lower-contact moments such as entering and leaving the restaurant.
Main takeaway from the visual
The chart shows where restaurant operators can focus redesign. Contactless ordering, queue management, and safer handoff processes target the highest-risk parts of the customer journey instead of treating every step as equally risky.
Key standout values or extremes
The highest scores are 85 for the customer waiting in line and 82 for entering the order at the kiosk. The lowest visible scores are 20 when the customer enters the restaurant and 15 when the customer leaves.
Controls / sequence, when applicable
This is a static area chart profile; there are no in-chart controls to operate.
Companion media, when applicable
There is no separate companion audio or video; the stepped area chart is the full visual on this page.