Source page: McKinsey & Company
Commentary
Riding the resignation wave
Hybrid work | Diversity & Inclusion
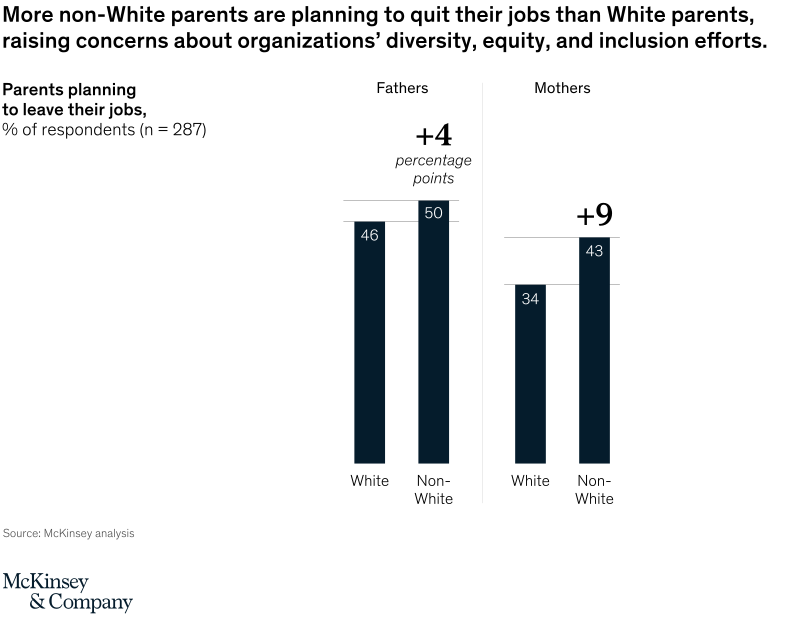
January 10, 2022 – The turnover tsunami sweeping over the workforce is carrying with it more parents of color than their White colleagues. Businesses focused on diversity, equity, and inclusion efforts have cause for concern since as many as 50 percent of non-White parents indicated in our recent survey that they planned to leave their jobs.
To read the article, see “Married to the job no more: Craving flexibility, parents are quitting to get it,” December 3, 2021.
customizer here
Visual form
Two-panel grouped bar chart.
Layout / body structure
The chart is split into two narrow panels, one for fathers and one for mothers. In each panel, a White bar sits beside a Non-White bar, and a large percentage-point difference label is placed above the pair.
What is being compared
The chart compares the share of parents planning to leave their jobs. It compares White and Non-White respondents separately for fathers and for mothers.
Measurement system
The vertical measure is percent of respondents. Each bar is directly labeled with its value, and the gap between the two bars in each panel is summarized as a percentage-point difference above the pair.
Visible structure inside the graphic
There are only four bars in total: two in the Fathers panel and two in the Mothers panel. The Fathers pair shows 46 for White and 50 for Non-White respondents, while the Mothers pair shows 34 for White and 43 for Non-White respondents, with +4 and +9 labels above the groups.
Main takeaway from the visual
Non-White parents are more likely than White parents to say they plan to leave their jobs, and that gap is especially pronounced among mothers. The larger separation in the Mothers panel makes the resignation wave look like a sharper diversity risk for women with children than for fathers alone.
Key standout values or extremes
Among fathers, the chart shows 46 percent of White respondents and 50 percent of Non-White respondents planning to leave, a 4-point gap. Among mothers, the values are 34 percent for White respondents and 43 percent for Non-White respondents, a 9-point gap and the largest spread on the page.
Controls / sequence, when applicable
This is a static chart image with no in-chart controls to operate.
Companion media, when applicable
There is no separate companion audio or video; the chart image is the full visual on this page.