Source page: McKinsey & Company
Commentary
Risk premiums are overrated
M&A | Risk
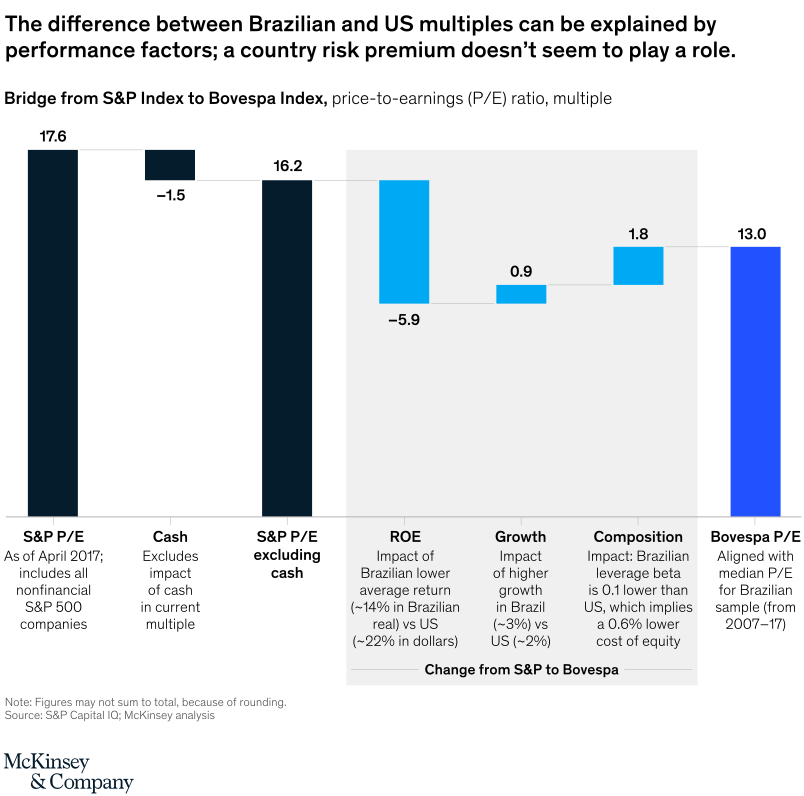
July 20, 2021 – Our new analysis suggests that country risk premiums are often set too high by industry analysts, leading to overvaluation—and missed investment opportunities. In this Brazilian example, the difference between S&P 500 and Bovespa price/earnings ratios can be explained entirely by performance. Investors take heed: a risk premium for an emerging-market company may not always be necessary.
To read the article, see “Don’t overthink your approach to valuation in emerging markets,” July 15, 2021.
customizer here
Visual form
Waterfall bridge chart.
Layout / body structure
The chart is a single left-to-right bridge built on one horizontal multiple scale. Reader starts at the S&P P/E bar, moves through the cash adjustment and the ex-cash anchor, then follows the shaded change block through ROE, growth, and composition before landing on the final Bovespa P/E bar; notes and source sit underneath.
What is being compared
The chart compares the price-to-earnings multiple for the S&P index with the Bovespa index and breaks the gap into four components: cash, return on equity, growth, and composition.
Measurement system
The measurement is P/E ratio in multiple points. The anchor bars are labeled 17.6 for the starting S&P P/E, 16.2 for the S&P P/E excluding cash, and 13.0 for the final Bovespa P/E, while the step bars show positive or negative contributions in multiple points.
Visible structure inside the graphic
A tall dark bar anchors the left side, a small dark cash block sits above the bridge, and a second dark anchor resets the series before three blue contribution bars step across the shaded comparison area. Each component is labeled directly, and the final blue bar at the right closes the bridge on the Bovespa level.
Main takeaway from the visual
The dominant visible move is the large downward ROE adjustment, which does most of the work in explaining why the Brazilian multiple ends below the US multiple. Growth and composition make only small upward offsets, so the gap reads as a performance-based bridge rather than a risk-premium story.
Key standout values or extremes
The chart starts at 17.6, drops 1.5 for cash, resets at 16.2, then falls 5.9 on ROE, rises 0.9 on growth and 1.8 on composition, and ends at 13.0. The ROE step is by far the biggest single movement in the bridge.
Controls / sequence, when applicable
This is a static chart image with no in-chart controls to operate.
Companion media, when applicable
There is no separate companion audio or video; the chart image is the full visual on this page.